library(tidyverse)
library(glue)Exercise 4A - Solutions: Scripting in R - Conditions and For-loops
In this exercise you will practice your scripting in R.
Getting started
Load libraries and the joined diabetes data set.
diabetes_glucose <- readxl::read_excel('../data/exercise2_diabetes_glucose.xlsx')
diabetes_glucose
# A tibble: 1,422 × 13
ID Sex Age BloodPressure BMI PhysicalActivity Smoker Diabetes
<chr> <chr> <dbl> <dbl> <dbl> <dbl> <chr> <dbl>
1 34120 Female 28 75 25.4 92 Never 0
2 34120 Female 28 75 25.4 92 Never 0
3 34120 Female 28 75 25.4 92 Never 0
4 27458 Female 55 72 24.6 86 Never 0
5 27458 Female 55 72 24.6 86 Never 0
6 27458 Female 55 72 24.6 86 Never 0
7 70630 Male 22 80 24.9 139 Unknown 0
8 70630 Male 22 80 24.9 139 Unknown 0
9 70630 Male 22 80 24.9 139 Unknown 0
10 13861 Female 56 72 37.1 64 Unknown 1
# ℹ 1,412 more rows
# ℹ 5 more variables: Serum_ca2 <dbl>, Married <chr>, Work <chr>,
# Measurement <chr>, `Glucose (mmol/L)` <dbl>If-else statements
In these exercises we don’t use the dataframe yet, that comes later when we have loops. For this part, just declare variables to test your statements, e.g. bp <- 120.
- Write an if-else statement that prints whether a person has high (more than 100), low (lower than 50) or normal blood pressure (between 50 and 100).
bp <- 80

if (bp > 100){
  print('High blood pressure')
} else if (bp < 50) {
  print('Low blood pressure')
} else {
  print('Normal blood pressure')
}
[1] "Normal blood pressure"- Write an if-else statement that assigns people high, moderate or low health risk based on their smoking habits (variable
Smoker) and BMI:
Smoker and BMI greater than 35 -> high risk
Smoker or BMI greater than 35 -> moderate risk
otherwise low risk
And Smoker should be one of “Smoker”, “Former”, “Never”, “Unknown”.
Verify that your statement works for different combinations of smoking habits and BMI.
Smoker <- 'Smoker'
BMI <- 40

if (Smoker == 'Smoker' & BMI > 35){
  print('High risk')
} else if (Smoker == 'Smoker' | BMI > 35) {
  print('Moderate risk')
} else {
  print('Low risk')
}
[1] "High risk"Loops
- Print each column name in the
diabetes_glucosedata frame using a for loop.
for (col in colnames(diabetes_glucose)) {
  print(col)
}
[1] "ID"
[1] "Sex"
[1] "Age"
[1] "BloodPressure"
[1] "BMI"
[1] "PhysicalActivity"
[1] "Smoker"
[1] "Diabetes"
[1] "Serum_ca2"
[1] "Married"
[1] "Work"
[1] "Measurement"
[1] "Glucose (mmol/L)"- Loop over all rows of diabetes_glucose and determine whether the person’s blood pressure is high, low or normal with the same conditions as in 1. Print the blood pressure value as well as the statement so you can verify whether you have classified the blood pressure correctly as high, normal or low.
for (i in 1:nrow(diabetes_glucose)) {
  bp <- diabetes_glucose[i, ]$BloodPressure
  ID <- diabetes_glucose[i, ]$ID
  if (bp > 100){
    print(paste('ID:', ID, '-', bp,'is high blood pressure'))
  }
}
[1] "ID: 61960 - 108 is high blood pressure"
[1] "ID: 61960 - 108 is high blood pressure"
[1] "ID: 61960 - 108 is high blood pressure"
[1] "ID: 31154 - 104 is high blood pressure"
[1] "ID: 31154 - 104 is high blood pressure"
[1] "ID: 31154 - 104 is high blood pressure"
[1] "ID: 17739 - 110 is high blood pressure"
[1] "ID: 17739 - 110 is high blood pressure"
[1] "ID: 17739 - 110 is high blood pressure"
[1] "ID: 49669 - 106 is high blood pressure"
[1] "ID: 49669 - 106 is high blood pressure"
[1] "ID: 49669 - 106 is high blood pressure"
[1] "ID: 34060 - 104 is high blood pressure"
[1] "ID: 34060 - 104 is high blood pressure"
[1] "ID: 34060 - 104 is high blood pressure"
[1] "ID: 29217 - 106 is high blood pressure"
[1] "ID: 29217 - 106 is high blood pressure"
[1] "ID: 29217 - 106 is high blood pressure"
[1] "ID: 68614 - 108 is high blood pressure"
[1] "ID: 68614 - 108 is high blood pressure"
[1] "ID: 68614 - 108 is high blood pressure"
[1] "ID: 58282 - 110 is high blood pressure"
[1] "ID: 58282 - 110 is high blood pressure"
[1] "ID: 58282 - 110 is high blood pressure"
[1] "ID: 51983 - 114 is high blood pressure"
[1] "ID: 51983 - 114 is high blood pressure"
[1] "ID: 51983 - 114 is high blood pressure"
[1] "ID: 50965 - 102 is high blood pressure"
[1] "ID: 50965 - 102 is high blood pressure"
[1] "ID: 50965 - 102 is high blood pressure"
[1] "ID: 21058 - 110 is high blood pressure"
[1] "ID: 21058 - 110 is high blood pressure"
[1] "ID: 21058 - 110 is high blood pressure"- Loop over all rows of diabetes_glucose and extract the smoking habits and BMI for each row and determine the health risk with the same conditions as in Exercise 4.2. Print the smoking habits and BMI as well as the health risk level to make it easier to see whether your code works correctly.
TipHint
Extract value for i’th row in specific column: df$col1[i]
An easy way to printing several variables is to pass a vector into print: print(c(this, and_that, and_this_too))
#We'll only show the first 10 rows here for brevity
#for (i in 1:nrow(diabetes_glucose)) {

for (i in 1:nrow(diabetes_glucose)) {
  Smoker <- diabetes_glucose$Smoker[i]
  BMI <- diabetes_glucose$BMI[i]

  if (Smoker == 'Smoker' & BMI > 35){
    print(c(Smoker, BMI, 'High risk'))
  } else if (Smoker == 'Smoker' | BMI > 35) {
    print(c(Smoker, BMI,'Moderate risk'))
  } else {
    print(c(Smoker, BMI,'Low risk'))
  }
}
[1] "Never" "25.4" "Low risk"
[1] "Never" "25.4" "Low risk"
[1] "Never" "25.4" "Low risk"
[1] "Never" "24.6" "Low risk"
[1] "Never" "24.6" "Low risk"
[1] "Never" "24.6" "Low risk"
[1] "Unknown" "24.9" "Low risk"
[1] "Unknown" "24.9" "Low risk"
[1] "Unknown" "24.9" "Low risk"
[1] "Unknown" "37.1" "Moderate risk"
[1] "Unknown" "37.1" "Moderate risk"
[1] "Unknown" "37.1" "Moderate risk"
[1] "Former" "23" "Low risk"
[1] "Former" "23" "Low risk"
[1] "Former" "23" "Low risk"
[1] "Smoker" "33.8" "Moderate risk"
[1] "Smoker" "33.8" "Moderate risk"
[1] "Smoker" "33.8" "Moderate risk"
[1] "Unknown" "33.3" "Low risk"
[1] "Unknown" "33.3" "Low risk"
[1] "Unknown" "33.3" "Low risk"
[1] "Smoker" "31.1" "Moderate risk"
[1] "Smoker" "31.1" "Moderate risk"
[1] "Smoker" "31.1" "Moderate risk"
[1] "Never" "44.5" "Moderate risk"
[1] "Never" "44.5" "Moderate risk"
[1] "Never" "44.5" "Moderate risk"
[1] "Smoker" "36.4" "High risk"
[1] "Smoker" "36.4" "High risk"
[1] "Smoker" "36.4" "High risk"
[1] "Former" "26.7" "Low risk"
[1] "Former" "26.7" "Low risk"
[1] "Former" "26.7" "Low risk"
[1] "Never" "32.4" "Low risk"
[1] "Never" "32.4" "Low risk"
[1] "Never" "32.4" "Low risk"
[1] "Never" "25.4" "Low risk"
[1] "Never" "25.4" "Low risk"
[1] "Never" "25.4" "Low risk"
[1] "Smoker" "28" "Moderate risk"
[1] "Smoker" "28" "Moderate risk"
[1] "Smoker" "28" "Moderate risk"
[1] "Smoker" "34.6" "Moderate risk"
[1] "Smoker" "34.6" "Moderate risk"
[1] "Smoker" "34.6" "Moderate risk"
[1] "Never" "22.2" "Low risk"
[1] "Never" "22.2" "Low risk"
[1] "Never" "22.2" "Low risk"
[1] "Never" "22.4" "Low risk"
[1] "Never" "22.4" "Low risk"
[1] "Never" "22.4" "Low risk"
[1] "Former" "36.6" "Moderate risk"
[1] "Former" "36.6" "Moderate risk"
[1] "Former" "36.6" "Moderate risk"
[1] "Unknown" "21.7" "Low risk"
[1] "Unknown" "21.7" "Low risk"
[1] "Unknown" "21.7" "Low risk"
[1] "Former" "33" "Low risk"
[1] "Former" "33" "Low risk"
[1] "Former" "33" "Low risk"
[1] "Former" "23.7" "Low risk"
[1] "Former" "23.7" "Low risk"
[1] "Former" "23.7" "Low risk"
[1] "Unknown" "34" "Low risk"
[1] "Unknown" "34" "Low risk"
[1] "Unknown" "34" "Low risk"
[1] "Never" "29.7" "Low risk"
[1] "Never" "29.7" "Low risk"
[1] "Never" "29.7" "Low risk"
[1] "Never" "18.1" "Low risk"
[1] "Never" "18.1" "Low risk"
[1] "Never" "18.1" "Low risk"
[1] "Smoker" "39" "High risk"
[1] "Smoker" "39" "High risk"
[1] "Smoker" "39" "High risk"
[1] "Unknown" "34.6" "Low risk"
[1] "Unknown" "34.6" "Low risk"
[1] "Unknown" "34.6" "Low risk"
[1] "Former" "28.4" "Low risk"
[1] "Former" "28.4" "Low risk"
[1] "Former" "28.4" "Low risk"
[1] "Former" "32.4" "Low risk"
[1] "Former" "32.4" "Low risk"
[1] "Former" "32.4" "Low risk"
[1] "Smoker" "36.5" "High risk"
[1] "Smoker" "36.5" "High risk"
[1] "Smoker" "36.5" "High risk"
[1] "Former" "24.3" "Low risk"
[1] "Former" "24.3" "Low risk"
[1] "Former" "24.3" "Low risk"
[1] "Former" "31.5" "Low risk"
[1] "Former" "31.5" "Low risk"
[1] "Former" "31.5" "Low risk"
[1] "Smoker" "37.8" "High risk"
[1] "Smoker" "37.8" "High risk"
[1] "Smoker" "37.8" "High risk"
[1] "Smoker" "23.9" "Moderate risk"
[1] "Smoker" "23.9" "Moderate risk"
[1] "Smoker" "23.9" "Moderate risk"
[1] "Smoker" "30.4" "Moderate risk"
[1] "Smoker" "30.4" "Moderate risk"
[1] "Smoker" "30.4" "Moderate risk"
[1] "Former" "28.8" "Low risk"
[1] "Former" "28.8" "Low risk"
[1] "Former" "28.8" "Low risk"
[1] "Former" "37.9" "Moderate risk"
[1] "Former" "37.9" "Moderate risk"
[1] "Former" "37.9" "Moderate risk"
[1] "Smoker" "25.1" "Moderate risk"
[1] "Smoker" "25.1" "Moderate risk"
[1] "Smoker" "25.1" "Moderate risk"
[1] "Never" "21.6" "Low risk"
[1] "Never" "21.6" "Low risk"
[1] "Never" "21.6" "Low risk"
[1] "Never" "28.2" "Low risk"
[1] "Never" "28.2" "Low risk"
[1] "Never" "28.2" "Low risk"
[1] "Former" "40.9" "Moderate risk"
[1] "Former" "40.9" "Moderate risk"
[1] "Former" "40.9" "Moderate risk"
[1] "Smoker" "34.7" "Moderate risk"
[1] "Smoker" "34.7" "Moderate risk"
[1] "Smoker" "34.7" "Moderate risk"
[1] "Smoker" "27.9" "Moderate risk"
[1] "Smoker" "27.9" "Moderate risk"
[1] "Smoker" "27.9" "Moderate risk"
[1] "Unknown" "28.3" "Low risk"
[1] "Unknown" "28.3" "Low risk"
[1] "Unknown" "28.3" "Low risk"
[1] "Never" "27.5" "Low risk"
[1] "Never" "27.5" "Low risk"
[1] "Never" "27.5" "Low risk"
[1] "Smoker" "44" "High risk"
[1] "Smoker" "44" "High risk"
[1] "Smoker" "44" "High risk"
[1] "Former" "34.3" "Low risk"
[1] "Former" "34.3" "Low risk"
[1] "Former" "34.3" "Low risk"
[1] "Never" "29.4" "Low risk"
[1] "Never" "29.4" "Low risk"
[1] "Never" "29.4" "Low risk"
[1] "Former" "21.1" "Low risk"
[1] "Former" "21.1" "Low risk"
[1] "Former" "21.1" "Low risk"
[1] "Smoker" "32.3" "Moderate risk"
[1] "Smoker" "32.3" "Moderate risk"
[1] "Smoker" "32.3" "Moderate risk"
[1] "Never" "27" "Low risk"
[1] "Never" "27" "Low risk"
[1] "Never" "27" "Low risk"
[1] "Former" "20.8" "Low risk"
[1] "Former" "20.8" "Low risk"
[1] "Former" "20.8" "Low risk"
[1] "Unknown" "18.4" "Low risk"
[1] "Unknown" "18.4" "Low risk"
[1] "Unknown" "18.4" "Low risk"
[1] "Never" "28.4" "Low risk"
[1] "Never" "28.4" "Low risk"
[1] "Never" "28.4" "Low risk"
[1] "Never" "25.4" "Low risk"
[1] "Never" "25.4" "Low risk"
[1] "Never" "25.4" "Low risk"
[1] "Smoker" "22.4" "Moderate risk"
[1] "Smoker" "22.4" "Moderate risk"
[1] "Smoker" "22.4" "Moderate risk"
[1] "Unknown" "15.3" "Low risk"
[1] "Unknown" "15.3" "Low risk"
[1] "Unknown" "15.3" "Low risk"
[1] "Never" "18.7" "Low risk"
[1] "Never" "18.7" "Low risk"
[1] "Never" "18.7" "Low risk"
[1] "Former" "34.5" "Low risk"
[1] "Former" "34.5" "Low risk"
[1] "Former" "34.5" "Low risk"
[1] "Former" "21" "Low risk"
[1] "Former" "21" "Low risk"
[1] "Former" "21" "Low risk"
[1] "Never" "29.8" "Low risk"
[1] "Never" "29.8" "Low risk"
[1] "Never" "29.8" "Low risk"
[1] "Never" "27.2" "Low risk"
[1] "Never" "27.2" "Low risk"
[1] "Never" "27.2" "Low risk"
[1] "Smoker" "35.8" "High risk"
[1] "Smoker" "35.8" "High risk"
[1] "Smoker" "35.8" "High risk"
[1] "Never" "33.4" "Low risk"
[1] "Never" "33.4" "Low risk"
[1] "Never" "33.4" "Low risk"
[1] "Never" "30.8" "Low risk"
[1] "Never" "30.8" "Low risk"
[1] "Never" "30.8" "Low risk"
[1] "Never" "23.1" "Low risk"
[1] "Never" "23.1" "Low risk"
[1] "Never" "23.1" "Low risk"
[1] "Smoker" "26.7" "Moderate risk"
[1] "Smoker" "26.7" "Moderate risk"
[1] "Smoker" "26.7" "Moderate risk"
[1] "Former" "20.5" "Low risk"
[1] "Former" "20.5" "Low risk"
[1] "Former" "20.5" "Low risk"
[1] "Never" "19.2" "Low risk"
[1] "Never" "19.2" "Low risk"
[1] "Never" "19.2" "Low risk"
[1] "Unknown" "23.5" "Low risk"
[1] "Unknown" "23.5" "Low risk"
[1] "Unknown" "23.5" "Low risk"
[1] "Smoker" "34" "Moderate risk"
[1] "Smoker" "34" "Moderate risk"
[1] "Smoker" "34" "Moderate risk"
[1] "Never" "21.2" "Low risk"
[1] "Never" "21.2" "Low risk"
[1] "Never" "21.2" "Low risk"
[1] "Smoker" "29.3" "Moderate risk"
[1] "Smoker" "29.3" "Moderate risk"
[1] "Smoker" "29.3" "Moderate risk"
[1] "Smoker" "32.9" "Moderate risk"
[1] "Smoker" "32.9" "Moderate risk"
[1] "Smoker" "32.9" "Moderate risk"
[1] "Unknown" "23.9" "Low risk"
[1] "Unknown" "23.9" "Low risk"
[1] "Unknown" "23.9" "Low risk"
[1] "Never" "26.5" "Low risk"
[1] "Never" "26.5" "Low risk"
[1] "Never" "26.5" "Low risk"
[1] "Unknown" "31.6" "Low risk"
[1] "Unknown" "31.6" "Low risk"
[1] "Unknown" "31.6" "Low risk"
[1] "Never" "23.3" "Low risk"
[1] "Never" "23.3" "Low risk"
[1] "Never" "23.3" "Low risk"
[1] "Never" "19.4" "Low risk"
[1] "Never" "19.4" "Low risk"
[1] "Never" "19.4" "Low risk"
[1] "Never" "40.9" "Moderate risk"
[1] "Never" "40.9" "Moderate risk"
[1] "Never" "40.9" "Moderate risk"
[1] "Smoker" "36.6" "High risk"
[1] "Smoker" "36.6" "High risk"
[1] "Smoker" "36.6" "High risk"
[1] "Smoker" "28.8" "Moderate risk"
[1] "Smoker" "28.8" "Moderate risk"
[1] "Smoker" "28.8" "Moderate risk"
[1] "Smoker" "33.6" "Moderate risk"
[1] "Smoker" "33.6" "Moderate risk"
[1] "Smoker" "33.6" "Moderate risk"
[1] "Smoker" "34.2" "Moderate risk"
[1] "Smoker" "34.2" "Moderate risk"
[1] "Smoker" "34.2" "Moderate risk"
[1] "Former" "37.2" "Moderate risk"
[1] "Former" "37.2" "Moderate risk"
[1] "Former" "37.2" "Moderate risk"
[1] "Smoker" "26.8" "Moderate risk"
[1] "Smoker" "26.8" "Moderate risk"
[1] "Smoker" "26.8" "Moderate risk"
[1] "Former" "42.4" "Moderate risk"
[1] "Former" "42.4" "Moderate risk"
[1] "Former" "42.4" "Moderate risk"
[1] "Never" "27.7" "Low risk"
[1] "Never" "27.7" "Low risk"
[1] "Never" "27.7" "Low risk"
[1] "Never" "25.8" "Low risk"
[1] "Never" "25.8" "Low risk"
[1] "Never" "25.8" "Low risk"
[1] "Unknown" "30.3" "Low risk"
[1] "Unknown" "30.3" "Low risk"
[1] "Unknown" "30.3" "Low risk"
[1] "Never" "33.6" "Low risk"
[1] "Never" "33.6" "Low risk"
[1] "Never" "33.6" "Low risk"
[1] "Unknown" "29.8" "Low risk"
[1] "Unknown" "29.8" "Low risk"
[1] "Unknown" "29.8" "Low risk"
[1] "Former" "23.6" "Low risk"
[1] "Former" "23.6" "Low risk"
[1] "Former" "23.6" "Low risk"
[1] "Unknown" "21.1" "Low risk"
[1] "Unknown" "21.1" "Low risk"
[1] "Unknown" "21.1" "Low risk"
[1] "Unknown" "32.9" "Low risk"
[1] "Unknown" "32.9" "Low risk"
[1] "Unknown" "32.9" "Low risk"
[1] "Former" "32.5" "Low risk"
[1] "Former" "32.5" "Low risk"
[1] "Former" "32.5" "Low risk"
[1] "Smoker" "31.2" "Moderate risk"
[1] "Smoker" "31.2" "Moderate risk"
[1] "Smoker" "31.2" "Moderate risk"
[1] "Smoker" "35" "Moderate risk"
[1] "Smoker" "35" "Moderate risk"
[1] "Smoker" "35" "Moderate risk"
[1] "Former" "20.1" "Low risk"
[1] "Former" "20.1" "Low risk"
[1] "Former" "20.1" "Low risk"
[1] "Former" "21" "Low risk"
[1] "Former" "21" "Low risk"
[1] "Former" "21" "Low risk"
[1] "Never" "19.7" "Low risk"
[1] "Never" "19.7" "Low risk"
[1] "Never" "19.7" "Low risk"
[1] "Never" "16.2" "Low risk"
[1] "Never" "16.2" "Low risk"
[1] "Never" "16.2" "Low risk"
[1] "Smoker" "25.7" "Moderate risk"
[1] "Smoker" "25.7" "Moderate risk"
[1] "Smoker" "25.7" "Moderate risk"
[1] "Former" "16.2" "Low risk"
[1] "Former" "16.2" "Low risk"
[1] "Former" "16.2" "Low risk"
[1] "Never" "17.7" "Low risk"
[1] "Never" "17.7" "Low risk"
[1] "Never" "17.7" "Low risk"
[1] "Former" "31.8" "Low risk"
[1] "Former" "31.8" "Low risk"
[1] "Former" "31.8" "Low risk"
[1] "Former" "27.7" "Low risk"
[1] "Former" "27.7" "Low risk"
[1] "Former" "27.7" "Low risk"
[1] "Unknown" "24.4" "Low risk"
[1] "Unknown" "24.4" "Low risk"
[1] "Unknown" "24.4" "Low risk"
[1] "Never" "40" "Moderate risk"
[1] "Never" "40" "Moderate risk"
[1] "Never" "40" "Moderate risk"
[1] "Former" "36.8" "Moderate risk"
[1] "Former" "36.8" "Moderate risk"
[1] "Former" "36.8" "Moderate risk"
[1] "Former" "32.8" "Low risk"
[1] "Former" "32.8" "Low risk"
[1] "Former" "32.8" "Low risk"
[1] "Unknown" "34.1" "Low risk"
[1] "Unknown" "34.1" "Low risk"
[1] "Unknown" "34.1" "Low risk"
[1] "Never" "25.7" "Low risk"
[1] "Never" "25.7" "Low risk"
[1] "Never" "25.7" "Low risk"
[1] "Never" "32.9" "Low risk"
[1] "Never" "32.9" "Low risk"
[1] "Never" "32.9" "Low risk"
[1] "Smoker" "34.2" "Moderate risk"
[1] "Smoker" "34.2" "Moderate risk"
[1] "Smoker" "34.2" "Moderate risk"
[1] "Never" "24.6" "Low risk"
[1] "Never" "24.6" "Low risk"
[1] "Never" "24.6" "Low risk"
[1] "Never" "24.2" "Low risk"
[1] "Never" "24.2" "Low risk"
[1] "Never" "24.2" "Low risk"
[1] "Never" "21.9" "Low risk"
[1] "Never" "21.9" "Low risk"
[1] "Never" "21.9" "Low risk"
[1] "Smoker" "30.1" "Moderate risk"
[1] "Smoker" "30.1" "Moderate risk"
[1] "Smoker" "30.1" "Moderate risk"
[1] "Unknown" "32.3" "Low risk"
[1] "Unknown" "32.3" "Low risk"
[1] "Unknown" "32.3" "Low risk"
[1] "Never" "25.8" "Low risk"
[1] "Never" "25.8" "Low risk"
[1] "Never" "25.8" "Low risk"
[1] "Smoker" "18.8" "Moderate risk"
[1] "Smoker" "18.8" "Moderate risk"
[1] "Smoker" "18.8" "Moderate risk"
[1] "Former" "35.9" "Moderate risk"
[1] "Former" "35.9" "Moderate risk"
[1] "Former" "35.9" "Moderate risk"
[1] "Former" "26.3" "Low risk"
[1] "Former" "26.3" "Low risk"
[1] "Former" "26.3" "Low risk"
[1] "Former" "27.2" "Low risk"
[1] "Former" "27.2" "Low risk"
[1] "Former" "27.2" "Low risk"
[1] "Never" "34.3" "Low risk"
[1] "Never" "34.3" "Low risk"
[1] "Never" "34.3" "Low risk"
[1] "Unknown" "32.5" "Low risk"
[1] "Unknown" "32.5" "Low risk"
[1] "Unknown" "32.5" "Low risk"
[1] "Never" "28.9" "Low risk"
[1] "Never" "28.9" "Low risk"
[1] "Never" "28.9" "Low risk"
[1] "Former" "33.5" "Low risk"
[1] "Former" "33.5" "Low risk"
[1] "Former" "33.5" "Low risk"
[1] "Former" "24.3" "Low risk"
[1] "Former" "24.3" "Low risk"
[1] "Former" "24.3" "Low risk"
[1] "Unknown" "30.3" "Low risk"
[1] "Unknown" "30.3" "Low risk"
[1] "Unknown" "30.3" "Low risk"
[1] "Unknown" "26.7" "Low risk"
[1] "Unknown" "26.7" "Low risk"
[1] "Unknown" "26.7" "Low risk"
[1] "Unknown" "30.9" "Low risk"
[1] "Unknown" "30.9" "Low risk"
[1] "Unknown" "30.9" "Low risk"
[1] "Former" "39.4" "Moderate risk"
[1] "Former" "39.4" "Moderate risk"
[1] "Former" "39.4" "Moderate risk"
[1] "Smoker" "36.1" "High risk"
[1] "Smoker" "36.1" "High risk"
[1] "Smoker" "36.1" "High risk"
[1] "Former" "23.5" "Low risk"
[1] "Former" "23.5" "Low risk"
[1] "Former" "23.5" "Low risk"
[1] "Smoker" "25.9" "Moderate risk"
[1] "Smoker" "25.9" "Moderate risk"
[1] "Smoker" "25.9" "Moderate risk"
[1] "Never" "24" "Low risk"
[1] "Never" "24" "Low risk"
[1] "Never" "24" "Low risk"
[1] "Former" "42.6" "Moderate risk"
[1] "Former" "42.6" "Moderate risk"
[1] "Former" "42.6" "Moderate risk"
[1] "Unknown" "32.4" "Low risk"
[1] "Unknown" "32.4" "Low risk"
[1] "Unknown" "32.4" "Low risk"
[1] "Smoker" "32" "Moderate risk"
[1] "Smoker" "32" "Moderate risk"
[1] "Smoker" "32" "Moderate risk"
[1] "Never" "22" "Low risk"
[1] "Never" "22" "Low risk"
[1] "Never" "22" "Low risk"
[1] "Former" "42.1" "Moderate risk"
[1] "Former" "42.1" "Moderate risk"
[1] "Former" "42.1" "Moderate risk"
[1] "Smoker" "42.3" "High risk"
[1] "Smoker" "42.3" "High risk"
[1] "Smoker" "42.3" "High risk"
[1] "Former" "33.6" "Low risk"
[1] "Former" "33.6" "Low risk"
[1] "Former" "33.6" "Low risk"
[1] "Never" "30.4" "Low risk"
[1] "Never" "30.4" "Low risk"
[1] "Never" "30.4" "Low risk"
[1] "Former" "37.9" "Moderate risk"
[1] "Former" "37.9" "Moderate risk"
[1] "Former" "37.9" "Moderate risk"
[1] "Former" "29.1" "Low risk"
[1] "Former" "29.1" "Low risk"
[1] "Former" "29.1" "Low risk"
[1] "Smoker" "33.3" "Moderate risk"
[1] "Smoker" "33.3" "Moderate risk"
[1] "Smoker" "33.3" "Moderate risk"
[1] "Smoker" "31.6" "Moderate risk"
[1] "Smoker" "31.6" "Moderate risk"
[1] "Smoker" "31.6" "Moderate risk"
[1] "Smoker" "32" "Moderate risk"
[1] "Smoker" "32" "Moderate risk"
[1] "Smoker" "32" "Moderate risk"
[1] "Never" "30.6" "Low risk"
[1] "Never" "30.6" "Low risk"
[1] "Never" "30.6" "Low risk"
[1] "Never" "25.8" "Low risk"
[1] "Never" "25.8" "Low risk"
[1] "Never" "25.8" "Low risk"
[1] "Never" "25.9" "Low risk"
[1] "Never" "25.9" "Low risk"
[1] "Never" "25.9" "Low risk"
[1] "Smoker" "17.2" "Moderate risk"
[1] "Smoker" "17.2" "Moderate risk"
[1] "Smoker" "17.2" "Moderate risk"
[1] "Former" "19.6" "Low risk"
[1] "Former" "19.6" "Low risk"
[1] "Former" "19.6" "Low risk"
[1] "Smoker" "32.4" "Moderate risk"
[1] "Smoker" "32.4" "Moderate risk"
[1] "Smoker" "32.4" "Moderate risk"
[1] "Never" "23.5" "Low risk"
[1] "Never" "23.5" "Low risk"
[1] "Never" "23.5" "Low risk"
[1] "Never" "30.8" "Low risk"
[1] "Never" "30.8" "Low risk"
[1] "Never" "30.8" "Low risk"
[1] "Smoker" "30.3" "Moderate risk"
[1] "Smoker" "30.3" "Moderate risk"
[1] "Smoker" "30.3" "Moderate risk"
[1] "Smoker" "32.9" "Moderate risk"
[1] "Smoker" "32.9" "Moderate risk"
[1] "Smoker" "32.9" "Moderate risk"
[1] "Former" "33.1" "Low risk"
[1] "Former" "33.1" "Low risk"
[1] "Former" "33.1" "Low risk"
[1] "Unknown" "26.9" "Low risk"
[1] "Unknown" "26.9" "Low risk"
[1] "Unknown" "26.9" "Low risk"
[1] "Former" "32.3" "Low risk"
[1] "Former" "32.3" "Low risk"
[1] "Former" "32.3" "Low risk"
[1] "Unknown" "30" "Low risk"
[1] "Unknown" "30" "Low risk"
[1] "Unknown" "30" "Low risk"
[1] "Never" "22.6" "Low risk"
[1] "Never" "22.6" "Low risk"
[1] "Never" "22.6" "Low risk"
[1] "Never" "35.1" "Moderate risk"
[1] "Never" "35.1" "Moderate risk"
[1] "Never" "35.1" "Moderate risk"
[1] "Smoker" "30.5" "Moderate risk"
[1] "Smoker" "30.5" "Moderate risk"
[1] "Smoker" "30.5" "Moderate risk"
[1] "Never" "36.5" "Moderate risk"
[1] "Never" "36.5" "Moderate risk"
[1] "Never" "36.5" "Moderate risk"
[1] "Never" "25.4" "Low risk"
[1] "Never" "25.4" "Low risk"
[1] "Never" "25.4" "Low risk"
[1] "Never" "24.7" "Low risk"
[1] "Never" "24.7" "Low risk"
[1] "Never" "24.7" "Low risk"
[1] "Never" "30.5" "Low risk"
[1] "Never" "30.5" "Low risk"
[1] "Never" "30.5" "Low risk"
[1] "Never" "24.2" "Low risk"
[1] "Never" "24.2" "Low risk"
[1] "Never" "24.2" "Low risk"
[1] "Smoker" "37.1" "High risk"
[1] "Smoker" "37.1" "High risk"
[1] "Smoker" "37.1" "High risk"
[1] "Never" "27.2" "Low risk"
[1] "Never" "27.2" "Low risk"
[1] "Never" "27.2" "Low risk"
[1] "Smoker" "19" "Moderate risk"
[1] "Smoker" "19" "Moderate risk"
[1] "Smoker" "19" "Moderate risk"
[1] "Former" "31.6" "Low risk"
[1] "Former" "31.6" "Low risk"
[1] "Former" "31.6" "Low risk"
[1] "Never" "23.9" "Low risk"
[1] "Never" "23.9" "Low risk"
[1] "Never" "23.9" "Low risk"
[1] "Never" "20.7" "Low risk"
[1] "Never" "20.7" "Low risk"
[1] "Never" "20.7" "Low risk"
[1] "Smoker" "36.3" "High risk"
[1] "Smoker" "36.3" "High risk"
[1] "Smoker" "36.3" "High risk"
[1] "Unknown" "22.3" "Low risk"
[1] "Unknown" "22.3" "Low risk"
[1] "Unknown" "22.3" "Low risk"
[1] "Unknown" "38.2" "Moderate risk"
[1] "Unknown" "38.2" "Moderate risk"
[1] "Unknown" "38.2" "Moderate risk"
[1] "Former" "21.6" "Low risk"
[1] "Former" "21.6" "Low risk"
[1] "Former" "21.6" "Low risk"
[1] "Smoker" "34.9" "Moderate risk"
[1] "Smoker" "34.9" "Moderate risk"
[1] "Smoker" "34.9" "Moderate risk"
[1] "Unknown" "27.7" "Low risk"
[1] "Unknown" "27.7" "Low risk"
[1] "Unknown" "27.7" "Low risk"
[1] "Never" "26.1" "Low risk"
[1] "Never" "26.1" "Low risk"
[1] "Never" "26.1" "Low risk"
[1] "Smoker" "43.4" "High risk"
[1] "Smoker" "43.4" "High risk"
[1] "Smoker" "43.4" "High risk"
[1] "Never" "21.4" "Low risk"
[1] "Never" "21.4" "Low risk"
[1] "Never" "21.4" "Low risk"
[1] "Never" "37.7" "Moderate risk"
[1] "Never" "37.7" "Moderate risk"
[1] "Never" "37.7" "Moderate risk"
[1] "Smoker" "35.9" "High risk"
[1] "Smoker" "35.9" "High risk"
[1] "Smoker" "35.9" "High risk"
[1] "Smoker" "32.8" "Moderate risk"
[1] "Smoker" "32.8" "Moderate risk"
[1] "Smoker" "32.8" "Moderate risk"
[1] "Never" "36.2" "Moderate risk"
[1] "Never" "36.2" "Moderate risk"
[1] "Never" "36.2" "Moderate risk"
[1] "Never" "31.5" "Low risk"
[1] "Never" "31.5" "Low risk"
[1] "Never" "31.5" "Low risk"
[1] "Never" "32.8" "Low risk"
[1] "Never" "32.8" "Low risk"
[1] "Never" "32.8" "Low risk"
[1] "Never" "38.5" "Moderate risk"
[1] "Never" "38.5" "Moderate risk"
[1] "Never" "38.5" "Moderate risk"
[1] "Smoker" "39.5" "High risk"
[1] "Smoker" "39.5" "High risk"
[1] "Smoker" "39.5" "High risk"
[1] "Smoker" "34.2" "Moderate risk"
[1] "Smoker" "34.2" "Moderate risk"
[1] "Smoker" "34.2" "Moderate risk"
[1] "Never" "29.5" "Low risk"
[1] "Never" "29.5" "Low risk"
[1] "Never" "29.5" "Low risk"
[1] "Former" "34.9" "Low risk"
[1] "Former" "34.9" "Low risk"
[1] "Former" "34.9" "Low risk"
[1] "Unknown" "21" "Low risk"
[1] "Unknown" "21" "Low risk"
[1] "Unknown" "21" "Low risk"
[1] "Unknown" "35.9" "Moderate risk"
[1] "Unknown" "35.9" "Moderate risk"
[1] "Unknown" "35.9" "Moderate risk"
[1] "Never" "21.8" "Low risk"
[1] "Never" "21.8" "Low risk"
[1] "Never" "21.8" "Low risk"
[1] "Former" "24.2" "Low risk"
[1] "Former" "24.2" "Low risk"
[1] "Former" "24.2" "Low risk"
[1] "Unknown" "42" "Moderate risk"
[1] "Unknown" "42" "Moderate risk"
[1] "Unknown" "42" "Moderate risk"
[1] "Smoker" "35.4" "High risk"
[1] "Smoker" "35.4" "High risk"
[1] "Smoker" "35.4" "High risk"
[1] "Smoker" "37.6" "High risk"
[1] "Smoker" "37.6" "High risk"
[1] "Smoker" "37.6" "High risk"
[1] "Smoker" "31.6" "Moderate risk"
[1] "Smoker" "31.6" "Moderate risk"
[1] "Smoker" "31.6" "Moderate risk"
[1] "Unknown" "34.3" "Low risk"
[1] "Unknown" "34.3" "Low risk"
[1] "Unknown" "34.3" "Low risk"
[1] "Never" "25.8" "Low risk"
[1] "Never" "25.8" "Low risk"
[1] "Never" "25.8" "Low risk"
[1] "Former" "34" "Low risk"
[1] "Former" "34" "Low risk"
[1] "Former" "34" "Low risk"
[1] "Former" "27.7" "Low risk"
[1] "Former" "27.7" "Low risk"
[1] "Former" "27.7" "Low risk"
[1] "Smoker" "30.4" "Moderate risk"
[1] "Smoker" "30.4" "Moderate risk"
[1] "Smoker" "30.4" "Moderate risk"
[1] "Former" "39.1" "Moderate risk"
[1] "Former" "39.1" "Moderate risk"
[1] "Former" "39.1" "Moderate risk"
[1] "Never" "18.2" "Low risk"
[1] "Never" "18.2" "Low risk"
[1] "Never" "18.2" "Low risk"
[1] "Smoker" "30.8" "Moderate risk"
[1] "Smoker" "30.8" "Moderate risk"
[1] "Smoker" "30.8" "Moderate risk"
[1] "Smoker" "34.9" "Moderate risk"
[1] "Smoker" "34.9" "Moderate risk"
[1] "Smoker" "34.9" "Moderate risk"
[1] "Former" "35.9" "Moderate risk"
[1] "Former" "35.9" "Moderate risk"
[1] "Former" "35.9" "Moderate risk"
[1] "Former" "27.1" "Low risk"
[1] "Former" "27.1" "Low risk"
[1] "Former" "27.1" "Low risk"
[1] "Smoker" "41.3" "High risk"
[1] "Smoker" "41.3" "High risk"
[1] "Smoker" "41.3" "High risk"
[1] "Never" "32.7" "Low risk"
[1] "Never" "32.7" "Low risk"
[1] "Never" "32.7" "Low risk"
[1] "Unknown" "34.7" "Low risk"
[1] "Unknown" "34.7" "Low risk"
[1] "Unknown" "34.7" "Low risk"
[1] "Never" "23.3" "Low risk"
[1] "Never" "23.3" "Low risk"
[1] "Never" "23.3" "Low risk"
[1] "Smoker" "31.6" "Moderate risk"
[1] "Smoker" "31.6" "Moderate risk"
[1] "Smoker" "31.6" "Moderate risk"
[1] "Unknown" "38.5" "Moderate risk"
[1] "Unknown" "38.5" "Moderate risk"
[1] "Unknown" "38.5" "Moderate risk"
[1] "Unknown" "28.4" "Low risk"
[1] "Unknown" "28.4" "Low risk"
[1] "Unknown" "28.4" "Low risk"
[1] "Former" "22.2" "Low risk"
[1] "Former" "22.2" "Low risk"
[1] "Former" "22.2" "Low risk"
[1] "Never" "26" "Low risk"
[1] "Never" "26" "Low risk"
[1] "Never" "26" "Low risk"
[1] "Smoker" "33.3" "Moderate risk"
[1] "Smoker" "33.3" "Moderate risk"
[1] "Smoker" "33.3" "Moderate risk"
[1] "Former" "26.3" "Low risk"
[1] "Former" "26.3" "Low risk"
[1] "Former" "26.3" "Low risk"
[1] "Never" "23.1" "Low risk"
[1] "Never" "23.1" "Low risk"
[1] "Never" "23.1" "Low risk"
[1] "Former" "22.3" "Low risk"
[1] "Former" "22.3" "Low risk"
[1] "Former" "22.3" "Low risk"
[1] "Smoker" "39.4" "High risk"
[1] "Smoker" "39.4" "High risk"
[1] "Smoker" "39.4" "High risk"
[1] "Unknown" "33.9" "Low risk"
[1] "Unknown" "33.9" "Low risk"
[1] "Unknown" "33.9" "Low risk"
[1] "Never" "25.2" "Low risk"
[1] "Never" "25.2" "Low risk"
[1] "Never" "25.2" "Low risk"
[1] "Former" "31.7" "Low risk"
[1] "Former" "31.7" "Low risk"
[1] "Former" "31.7" "Low risk"
[1] "Smoker" "42.9" "High risk"
[1] "Smoker" "42.9" "High risk"
[1] "Smoker" "42.9" "High risk"
[1] "Former" "32" "Low risk"
[1] "Former" "32" "Low risk"
[1] "Former" "32" "Low risk"
[1] "Never" "26.8" "Low risk"
[1] "Never" "26.8" "Low risk"
[1] "Never" "26.8" "Low risk"
[1] "Smoker" "31.4" "Moderate risk"
[1] "Smoker" "31.4" "Moderate risk"
[1] "Smoker" "31.4" "Moderate risk"
[1] "Former" "36.8" "Moderate risk"
[1] "Former" "36.8" "Moderate risk"
[1] "Former" "36.8" "Moderate risk"
[1] "Never" "22.3" "Low risk"
[1] "Never" "22.3" "Low risk"
[1] "Never" "22.3" "Low risk"
[1] "Former" "44" "Moderate risk"
[1] "Former" "44" "Moderate risk"
[1] "Former" "44" "Moderate risk"
[1] "Smoker" "34" "Moderate risk"
[1] "Smoker" "34" "Moderate risk"
[1] "Smoker" "34" "Moderate risk"
[1] "Never" "33.5" "Low risk"
[1] "Never" "33.5" "Low risk"
[1] "Never" "33.5" "Low risk"
[1] "Smoker" "39.7" "High risk"
[1] "Smoker" "39.7" "High risk"
[1] "Smoker" "39.7" "High risk"
[1] "Unknown" "34.9" "Low risk"
[1] "Unknown" "34.9" "Low risk"
[1] "Unknown" "34.9" "Low risk"
[1] "Never" "25.2" "Low risk"
[1] "Never" "25.2" "Low risk"
[1] "Never" "25.2" "Low risk"
[1] "Never" "26.8" "Low risk"
[1] "Never" "26.8" "Low risk"
[1] "Never" "26.8" "Low risk"
[1] "Never" "39.3" "Moderate risk"
[1] "Never" "39.3" "Moderate risk"
[1] "Never" "39.3" "Moderate risk"
[1] "Never" "42.9" "Moderate risk"
[1] "Never" "42.9" "Moderate risk"
[1] "Never" "42.9" "Moderate risk"
[1] "Smoker" "30.9" "Moderate risk"
[1] "Smoker" "30.9" "Moderate risk"
[1] "Smoker" "30.9" "Moderate risk"
[1] "Never" "23.3" "Low risk"
[1] "Never" "23.3" "Low risk"
[1] "Never" "23.3" "Low risk"
[1] "Unknown" "18.9" "Low risk"
[1] "Unknown" "18.9" "Low risk"
[1] "Unknown" "18.9" "Low risk"
[1] "Smoker" "35.6" "High risk"
[1] "Smoker" "35.6" "High risk"
[1] "Smoker" "35.6" "High risk"
[1] "Smoker" "37.9" "High risk"
[1] "Smoker" "37.9" "High risk"
[1] "Smoker" "37.9" "High risk"
[1] "Smoker" "34.8" "Moderate risk"
[1] "Smoker" "34.8" "Moderate risk"
[1] "Smoker" "34.8" "Moderate risk"
[1] "Smoker" "43.1" "High risk"
[1] "Smoker" "43.1" "High risk"
[1] "Smoker" "43.1" "High risk"
[1] "Unknown" "24.6" "Low risk"
[1] "Unknown" "24.6" "Low risk"
[1] "Unknown" "24.6" "Low risk"
[1] "Former" "33.2" "Low risk"
[1] "Former" "33.2" "Low risk"
[1] "Former" "33.2" "Low risk"
[1] "Unknown" "22.5" "Low risk"
[1] "Unknown" "22.5" "Low risk"
[1] "Unknown" "22.5" "Low risk"
[1] "Never" "24.9" "Low risk"
[1] "Never" "24.9" "Low risk"
[1] "Never" "24.9" "Low risk"
[1] "Smoker" "33.3" "Moderate risk"
[1] "Smoker" "33.3" "Moderate risk"
[1] "Smoker" "33.3" "Moderate risk"
[1] "Smoker" "21.3" "Moderate risk"
[1] "Smoker" "21.3" "Moderate risk"
[1] "Smoker" "21.3" "Moderate risk"
[1] "Former" "37.4" "Moderate risk"
[1] "Former" "37.4" "Moderate risk"
[1] "Former" "37.4" "Moderate risk"
[1] "Smoker" "33.3" "Moderate risk"
[1] "Smoker" "33.3" "Moderate risk"
[1] "Smoker" "33.3" "Moderate risk"
[1] "Never" "27.6" "Low risk"
[1] "Never" "27.6" "Low risk"
[1] "Never" "27.6" "Low risk"
[1] "Smoker" "38.5" "High risk"
[1] "Smoker" "38.5" "High risk"
[1] "Smoker" "38.5" "High risk"
[1] "Former" "25.6" "Low risk"
[1] "Former" "25.6" "Low risk"
[1] "Former" "25.6" "Low risk"
[1] "Smoker" "32.9" "Moderate risk"
[1] "Smoker" "32.9" "Moderate risk"
[1] "Smoker" "32.9" "Moderate risk"
[1] "Former" "30.5" "Low risk"
[1] "Former" "30.5" "Low risk"
[1] "Former" "30.5" "Low risk"
[1] "Smoker" "25.5" "Moderate risk"
[1] "Smoker" "25.5" "Moderate risk"
[1] "Smoker" "25.5" "Moderate risk"
[1] "Former" "30.5" "Low risk"
[1] "Former" "30.5" "Low risk"
[1] "Former" "30.5" "Low risk"
[1] "Smoker" "35.5" "High risk"
[1] "Smoker" "35.5" "High risk"
[1] "Smoker" "35.5" "High risk"
[1] "Smoker" "38.8" "High risk"
[1] "Smoker" "38.8" "High risk"
[1] "Smoker" "38.8" "High risk"
[1] "Smoker" "34.3" "Moderate risk"
[1] "Smoker" "34.3" "Moderate risk"
[1] "Smoker" "34.3" "Moderate risk"
[1] "Unknown" "29.2" "Low risk"
[1] "Unknown" "29.2" "Low risk"
[1] "Unknown" "29.2" "Low risk"
[1] "Never" "27.4" "Low risk"
[1] "Never" "27.4" "Low risk"
[1] "Never" "27.4" "Low risk"
[1] "Never" "34.2" "Low risk"
[1] "Never" "34.2" "Low risk"
[1] "Never" "34.2" "Low risk"
[1] "Smoker" "33.8" "Moderate risk"
[1] "Smoker" "33.8" "Moderate risk"
[1] "Smoker" "33.8" "Moderate risk"
[1] "Unknown" "30.5" "Low risk"
[1] "Unknown" "30.5" "Low risk"
[1] "Unknown" "30.5" "Low risk"
[1] "Never" "30.6" "Low risk"
[1] "Never" "30.6" "Low risk"
[1] "Never" "30.6" "Low risk"
[1] "Smoker" "34.7" "Moderate risk"
[1] "Smoker" "34.7" "Moderate risk"
[1] "Smoker" "34.7" "Moderate risk"
[1] "Smoker" "32.9" "Moderate risk"
[1] "Smoker" "32.9" "Moderate risk"
[1] "Smoker" "32.9" "Moderate risk"
[1] "Never" "35.5" "Moderate risk"
[1] "Never" "35.5" "Moderate risk"
[1] "Never" "35.5" "Moderate risk"
[1] "Never" "30.4" "Low risk"
[1] "Never" "30.4" "Low risk"
[1] "Never" "30.4" "Low risk"
[1] "Former" "20.1" "Low risk"
[1] "Former" "20.1" "Low risk"
[1] "Former" "20.1" "Low risk"
[1] "Never" "41.2" "Moderate risk"
[1] "Never" "41.2" "Moderate risk"
[1] "Never" "41.2" "Moderate risk"
[1] "Never" "30.3" "Low risk"
[1] "Never" "30.3" "Low risk"
[1] "Never" "30.3" "Low risk"
[1] "Never" "23.5" "Low risk"
[1] "Never" "23.5" "Low risk"
[1] "Never" "23.5" "Low risk"
[1] "Smoker" "21.8" "Moderate risk"
[1] "Smoker" "21.8" "Moderate risk"
[1] "Smoker" "21.8" "Moderate risk"
[1] "Smoker" "35.7" "High risk"
[1] "Smoker" "35.7" "High risk"
[1] "Smoker" "35.7" "High risk"
[1] "Smoker" "31.2" "Moderate risk"
[1] "Smoker" "31.2" "Moderate risk"
[1] "Smoker" "31.2" "Moderate risk"
[1] "Never" "17.6" "Low risk"
[1] "Never" "17.6" "Low risk"
[1] "Never" "17.6" "Low risk"
[1] "Former" "26.8" "Low risk"
[1] "Former" "26.8" "Low risk"
[1] "Former" "26.8" "Low risk"
[1] "Unknown" "24.5" "Low risk"
[1] "Unknown" "24.5" "Low risk"
[1] "Unknown" "24.5" "Low risk"
[1] "Never" "35.1" "Moderate risk"
[1] "Never" "35.1" "Moderate risk"
[1] "Never" "35.1" "Moderate risk"
[1] "Never" "17.4" "Low risk"
[1] "Never" "17.4" "Low risk"
[1] "Never" "17.4" "Low risk"
[1] "Former" "29.8" "Low risk"
[1] "Former" "29.8" "Low risk"
[1] "Former" "29.8" "Low risk"
[1] "Smoker" "28.7" "Moderate risk"
[1] "Smoker" "28.7" "Moderate risk"
[1] "Smoker" "28.7" "Moderate risk"
[1] "Never" "21" "Low risk"
[1] "Never" "21" "Low risk"
[1] "Never" "21" "Low risk"
[1] "Never" "27.6" "Low risk"
[1] "Never" "27.6" "Low risk"
[1] "Never" "27.6" "Low risk"
[1] "Never" "25.5" "Low risk"
[1] "Never" "25.5" "Low risk"
[1] "Never" "25.5" "Low risk"
[1] "Unknown" "39.4" "Moderate risk"
[1] "Unknown" "39.4" "Moderate risk"
[1] "Unknown" "39.4" "Moderate risk"
[1] "Former" "40" "Moderate risk"
[1] "Former" "40" "Moderate risk"
[1] "Former" "40" "Moderate risk"
[1] "Smoker" "32.5" "Moderate risk"
[1] "Smoker" "32.5" "Moderate risk"
[1] "Smoker" "32.5" "Moderate risk"
[1] "Smoker" "41.8" "High risk"
[1] "Smoker" "41.8" "High risk"
[1] "Smoker" "41.8" "High risk"
[1] "Former" "24.9" "Low risk"
[1] "Former" "24.9" "Low risk"
[1] "Former" "24.9" "Low risk"
[1] "Former" "27.7" "Low risk"
[1] "Former" "27.7" "Low risk"
[1] "Former" "27.7" "Low risk"
[1] "Former" "32.9" "Low risk"
[1] "Former" "32.9" "Low risk"
[1] "Former" "32.9" "Low risk"
[1] "Smoker" "44.1" "High risk"
[1] "Smoker" "44.1" "High risk"
[1] "Smoker" "44.1" "High risk"
[1] "Smoker" "34.4" "Moderate risk"
[1] "Smoker" "34.4" "Moderate risk"
[1] "Smoker" "34.4" "Moderate risk"
[1] "Smoker" "38.3" "High risk"
[1] "Smoker" "38.3" "High risk"
[1] "Smoker" "38.3" "High risk"
[1] "Smoker" "27.1" "Moderate risk"
[1] "Smoker" "27.1" "Moderate risk"
[1] "Smoker" "27.1" "Moderate risk"
[1] "Smoker" "33.7" "Moderate risk"
[1] "Smoker" "33.7" "Moderate risk"
[1] "Smoker" "33.7" "Moderate risk"
[1] "Former" "35.5" "Moderate risk"
[1] "Former" "35.5" "Moderate risk"
[1] "Former" "35.5" "Moderate risk"
[1] "Never" "28.3" "Low risk"
[1] "Never" "28.3" "Low risk"
[1] "Never" "28.3" "Low risk"
[1] "Smoker" "32.6" "Moderate risk"
[1] "Smoker" "32.6" "Moderate risk"
[1] "Smoker" "32.6" "Moderate risk"
[1] "Smoker" "32.9" "Moderate risk"
[1] "Smoker" "32.9" "Moderate risk"
[1] "Smoker" "32.9" "Moderate risk"
[1] "Smoker" "20.4" "Moderate risk"
[1] "Smoker" "20.4" "Moderate risk"
[1] "Smoker" "20.4" "Moderate risk"
[1] "Unknown" "30.3" "Low risk"
[1] "Unknown" "30.3" "Low risk"
[1] "Unknown" "30.3" "Low risk"
[1] "Former" "24.4" "Low risk"
[1] "Former" "24.4" "Low risk"
[1] "Former" "24.4" "Low risk"
[1] "Former" "42.3" "Moderate risk"
[1] "Former" "42.3" "Moderate risk"
[1] "Former" "42.3" "Moderate risk"
[1] "Former" "24.9" "Low risk"
[1] "Former" "24.9" "Low risk"
[1] "Former" "24.9" "Low risk"
[1] "Former" "31.2" "Low risk"
[1] "Former" "31.2" "Low risk"
[1] "Former" "31.2" "Low risk"
[1] "Smoker" "36.1" "High risk"
[1] "Smoker" "36.1" "High risk"
[1] "Smoker" "36.1" "High risk"
[1] "Former" "20.3" "Low risk"
[1] "Former" "20.3" "Low risk"
[1] "Former" "20.3" "Low risk"
[1] "Smoker" "23.7" "Moderate risk"
[1] "Smoker" "23.7" "Moderate risk"
[1] "Smoker" "23.7" "Moderate risk"
[1] "Unknown" "35.4" "Moderate risk"
[1] "Unknown" "35.4" "Moderate risk"
[1] "Unknown" "35.4" "Moderate risk"
[1] "Former" "35.8" "Moderate risk"
[1] "Former" "35.8" "Moderate risk"
[1] "Former" "35.8" "Moderate risk"
[1] "Unknown" "42.9" "Moderate risk"
[1] "Unknown" "42.9" "Moderate risk"
[1] "Unknown" "42.9" "Moderate risk"
[1] "Unknown" "24.9" "Low risk"
[1] "Unknown" "24.9" "Low risk"
[1] "Unknown" "24.9" "Low risk"
[1] "Never" "21.3" "Low risk"
[1] "Never" "21.3" "Low risk"
[1] "Never" "21.3" "Low risk"
[1] "Never" "27.2" "Low risk"
[1] "Never" "27.2" "Low risk"
[1] "Never" "27.2" "Low risk"
[1] "Smoker" "27.2" "Moderate risk"
[1] "Smoker" "27.2" "Moderate risk"
[1] "Smoker" "27.2" "Moderate risk"
[1] "Former" "33.4" "Low risk"
[1] "Former" "33.4" "Low risk"
[1] "Former" "33.4" "Low risk"
[1] "Smoker" "34.9" "Moderate risk"
[1] "Smoker" "34.9" "Moderate risk"
[1] "Smoker" "34.9" "Moderate risk"
[1] "Former" "45" "Moderate risk"
[1] "Former" "45" "Moderate risk"
[1] "Former" "45" "Moderate risk"
[1] "Former" "28.5" "Low risk"
[1] "Former" "28.5" "Low risk"
[1] "Former" "28.5" "Low risk"
[1] "Never" "23.1" "Low risk"
[1] "Never" "23.1" "Low risk"
[1] "Never" "23.1" "Low risk"
[1] "Smoker" "43.3" "High risk"
[1] "Smoker" "43.3" "High risk"
[1] "Smoker" "43.3" "High risk"
[1] "Smoker" "38.4" "High risk"
[1] "Smoker" "38.4" "High risk"
[1] "Smoker" "38.4" "High risk"
[1] "Never" "32.9" "Low risk"
[1] "Never" "32.9" "Low risk"
[1] "Never" "32.9" "Low risk"
[1] "Never" "18.5" "Low risk"
[1] "Never" "18.5" "Low risk"
[1] "Never" "18.5" "Low risk"
[1] "Smoker" "37.6" "High risk"
[1] "Smoker" "37.6" "High risk"
[1] "Smoker" "37.6" "High risk"
[1] "Never" "34.3" "Low risk"
[1] "Never" "34.3" "Low risk"
[1] "Never" "34.3" "Low risk"
[1] "Never" "33.7" "Low risk"
[1] "Never" "33.7" "Low risk"
[1] "Never" "33.7" "Low risk"
[1] "Smoker" "33.7" "Moderate risk"
[1] "Smoker" "33.7" "Moderate risk"
[1] "Smoker" "33.7" "Moderate risk"
[1] "Never" "18.8" "Low risk"
[1] "Never" "18.8" "Low risk"
[1] "Never" "18.8" "Low risk"
[1] "Never" "36.6" "Moderate risk"
[1] "Never" "36.6" "Moderate risk"
[1] "Never" "36.6" "Moderate risk"
[1] "Never" "31.5" "Low risk"
[1] "Never" "31.5" "Low risk"
[1] "Never" "31.5" "Low risk"
[1] "Smoker" "37.5" "High risk"
[1] "Smoker" "37.5" "High risk"
[1] "Smoker" "37.5" "High risk"
[1] "Unknown" "19.3" "Low risk"
[1] "Unknown" "19.3" "Low risk"
[1] "Unknown" "19.3" "Low risk"
[1] "Unknown" "23.3" "Low risk"
[1] "Unknown" "23.3" "Low risk"
[1] "Unknown" "23.3" "Low risk"
[1] "Former" "36.4" "Moderate risk"
[1] "Former" "36.4" "Moderate risk"
[1] "Former" "36.4" "Moderate risk"
[1] "Unknown" "21.6" "Low risk"
[1] "Unknown" "21.6" "Low risk"
[1] "Unknown" "21.6" "Low risk"
[1] "Never" "30" "Low risk"
[1] "Never" "30" "Low risk"
[1] "Never" "30" "Low risk"
[1] "Smoker" "32" "Moderate risk"
[1] "Smoker" "32" "Moderate risk"
[1] "Smoker" "32" "Moderate risk"
[1] "Smoker" "38" "High risk"
[1] "Smoker" "38" "High risk"
[1] "Smoker" "38" "High risk"
[1] "Smoker" "22.1" "Moderate risk"
[1] "Smoker" "22.1" "Moderate risk"
[1] "Smoker" "22.1" "Moderate risk"
[1] "Never" "21.3" "Low risk"
[1] "Never" "21.3" "Low risk"
[1] "Never" "21.3" "Low risk"
[1] "Smoker" "32.7" "Moderate risk"
[1] "Smoker" "32.7" "Moderate risk"
[1] "Smoker" "32.7" "Moderate risk"
[1] "Smoker" "43.2" "High risk"
[1] "Smoker" "43.2" "High risk"
[1] "Smoker" "43.2" "High risk"
[1] "Never" "17.4" "Low risk"
[1] "Never" "17.4" "Low risk"
[1] "Never" "17.4" "Low risk"
[1] "Smoker" "40.5" "High risk"
[1] "Smoker" "40.5" "High risk"
[1] "Smoker" "40.5" "High risk"
[1] "Smoker" "32.6" "Moderate risk"
[1] "Smoker" "32.6" "Moderate risk"
[1] "Smoker" "32.6" "Moderate risk"
[1] "Former" "33.7" "Low risk"
[1] "Former" "33.7" "Low risk"
[1] "Former" "33.7" "Low risk"
[1] "Never" "42.3" "Moderate risk"
[1] "Never" "42.3" "Moderate risk"
[1] "Never" "42.3" "Moderate risk"
[1] "Former" "43.3" "Moderate risk"
[1] "Former" "43.3" "Moderate risk"
[1] "Former" "43.3" "Moderate risk"
[1] "Smoker" "38.2" "High risk"
[1] "Smoker" "38.2" "High risk"
[1] "Smoker" "38.2" "High risk"
[1] "Never" "22.2" "Low risk"
[1] "Never" "22.2" "Low risk"
[1] "Never" "22.2" "Low risk"
[1] "Unknown" "24" "Low risk"
[1] "Unknown" "24" "Low risk"
[1] "Unknown" "24" "Low risk"
[1] "Never" "32.4" "Low risk"
[1] "Never" "32.4" "Low risk"
[1] "Never" "32.4" "Low risk"
[1] "Unknown" "33.9" "Low risk"
[1] "Unknown" "33.9" "Low risk"
[1] "Unknown" "33.9" "Low risk"
[1] "Never" "37.7" "Moderate risk"
[1] "Never" "37.7" "Moderate risk"
[1] "Never" "37.7" "Moderate risk"
[1] "Smoker" "37.8" "High risk"
[1] "Smoker" "37.8" "High risk"
[1] "Smoker" "37.8" "High risk"
[1] "Unknown" "26.8" "Low risk"
[1] "Unknown" "26.8" "Low risk"
[1] "Unknown" "26.8" "Low risk"
[1] "Never" "22.6" "Low risk"
[1] "Never" "22.6" "Low risk"
[1] "Never" "22.6" "Low risk"
[1] "Smoker" "34.6" "Moderate risk"
[1] "Smoker" "34.6" "Moderate risk"
[1] "Smoker" "34.6" "Moderate risk"
[1] "Smoker" "31.6" "Moderate risk"
[1] "Smoker" "31.6" "Moderate risk"
[1] "Smoker" "31.6" "Moderate risk"
[1] "Former" "33.8" "Low risk"
[1] "Former" "33.8" "Low risk"
[1] "Former" "33.8" "Low risk"
[1] "Never" "27.6" "Low risk"
[1] "Never" "27.6" "Low risk"
[1] "Never" "27.6" "Low risk"
[1] "Smoker" "30.4" "Moderate risk"
[1] "Smoker" "30.4" "Moderate risk"
[1] "Smoker" "30.4" "Moderate risk"
[1] "Never" "20.9" "Low risk"
[1] "Never" "20.9" "Low risk"
[1] "Never" "20.9" "Low risk"
[1] "Never" "23.3" "Low risk"
[1] "Never" "23.3" "Low risk"
[1] "Never" "23.3" "Low risk"
[1] "Never" "20.6" "Low risk"
[1] "Never" "20.6" "Low risk"
[1] "Never" "20.6" "Low risk"
[1] "Smoker" "20.1" "Moderate risk"
[1] "Smoker" "20.1" "Moderate risk"
[1] "Smoker" "20.1" "Moderate risk"
[1] "Former" "23.7" "Low risk"
[1] "Former" "23.7" "Low risk"
[1] "Former" "23.7" "Low risk"
[1] "Smoker" "33.6" "Moderate risk"
[1] "Smoker" "33.6" "Moderate risk"
[1] "Smoker" "33.6" "Moderate risk"
[1] "Former" "31.6" "Low risk"
[1] "Former" "31.6" "Low risk"
[1] "Former" "31.6" "Low risk"
[1] "Former" "32.6" "Low risk"
[1] "Former" "32.6" "Low risk"
[1] "Former" "32.6" "Low risk"
[1] "Never" "26.6" "Low risk"
[1] "Never" "26.6" "Low risk"
[1] "Never" "26.6" "Low risk"
[1] "Unknown" "31.2" "Low risk"
[1] "Unknown" "31.2" "Low risk"
[1] "Unknown" "31.2" "Low risk"
[1] "Unknown" "34.5" "Low risk"
[1] "Unknown" "34.5" "Low risk"
[1] "Unknown" "34.5" "Low risk"
[1] "Never" "28.7" "Low risk"
[1] "Never" "28.7" "Low risk"
[1] "Never" "28.7" "Low risk"
[1] "Never" "27.7" "Low risk"
[1] "Never" "27.7" "Low risk"
[1] "Never" "27.7" "Low risk"
[1] "Smoker" "27.9" "Moderate risk"
[1] "Smoker" "27.9" "Moderate risk"
[1] "Smoker" "27.9" "Moderate risk"
[1] "Unknown" "32" "Low risk"
[1] "Unknown" "32" "Low risk"
[1] "Unknown" "32" "Low risk"
[1] "Former" "49.4" "Moderate risk"
[1] "Former" "49.4" "Moderate risk"
[1] "Former" "49.4" "Moderate risk"
[1] "Former" "38.7" "Moderate risk"
[1] "Former" "38.7" "Moderate risk"
[1] "Former" "38.7" "Moderate risk"
[1] "Never" "27.2" "Low risk"
[1] "Never" "27.2" "Low risk"
[1] "Never" "27.2" "Low risk"
[1] "Former" "21.9" "Low risk"
[1] "Former" "21.9" "Low risk"
[1] "Former" "21.9" "Low risk"
[1] "Former" "25.1" "Low risk"
[1] "Former" "25.1" "Low risk"
[1] "Former" "25.1" "Low risk"
[1] "Former" "34.6" "Low risk"
[1] "Former" "34.6" "Low risk"
[1] "Former" "34.6" "Low risk"
[1] "Smoker" "35.5" "High risk"
[1] "Smoker" "35.5" "High risk"
[1] "Smoker" "35.5" "High risk"
[1] "Smoker" "27.1" "Moderate risk"
[1] "Smoker" "27.1" "Moderate risk"
[1] "Smoker" "27.1" "Moderate risk"
[1] "Smoker" "34.7" "Moderate risk"
[1] "Smoker" "34.7" "Moderate risk"
[1] "Smoker" "34.7" "Moderate risk"
[1] "Former" "19.9" "Low risk"
[1] "Former" "19.9" "Low risk"
[1] "Former" "19.9" "Low risk"
[1] "Former" "30.3" "Low risk"
[1] "Former" "30.3" "Low risk"
[1] "Former" "30.3" "Low risk"
[1] "Former" "31" "Low risk"
[1] "Former" "31" "Low risk"
[1] "Former" "31" "Low risk"
[1] "Unknown" "36" "Moderate risk"
[1] "Unknown" "36" "Moderate risk"
[1] "Unknown" "36" "Moderate risk"
[1] "Smoker" "32" "Moderate risk"
[1] "Smoker" "32" "Moderate risk"
[1] "Smoker" "32" "Moderate risk"
[1] "Former" "24.5" "Low risk"
[1] "Former" "24.5" "Low risk"
[1] "Former" "24.5" "Low risk"
[1] "Smoker" "33.3" "Moderate risk"
[1] "Smoker" "33.3" "Moderate risk"
[1] "Smoker" "33.3" "Moderate risk"
[1] "Smoker" "25.3" "Moderate risk"
[1] "Smoker" "25.3" "Moderate risk"
[1] "Smoker" "25.3" "Moderate risk"
[1] "Unknown" "24" "Low risk"
[1] "Unknown" "24" "Low risk"
[1] "Unknown" "24" "Low risk"
[1] "Former" "30.1" "Low risk"
[1] "Former" "30.1" "Low risk"
[1] "Former" "30.1" "Low risk"
[1] "Smoker" "32.5" "Moderate risk"
[1] "Smoker" "32.5" "Moderate risk"
[1] "Smoker" "32.5" "Moderate risk"
[1] "Former" "22.6" "Low risk"
[1] "Former" "22.6" "Low risk"
[1] "Former" "22.6" "Low risk"
[1] "Smoker" "37" "High risk"
[1] "Smoker" "37" "High risk"
[1] "Smoker" "37" "High risk"
[1] "Former" "16.4" "Low risk"
[1] "Former" "16.4" "Low risk"
[1] "Former" "16.4" "Low risk"
[1] "Smoker" "22.1" "Moderate risk"
[1] "Smoker" "22.1" "Moderate risk"
[1] "Smoker" "22.1" "Moderate risk"
[1] "Former" "38" "Moderate risk"
[1] "Former" "38" "Moderate risk"
[1] "Former" "38" "Moderate risk"
[1] "Unknown" "35.7" "Moderate risk"
[1] "Unknown" "35.7" "Moderate risk"
[1] "Unknown" "35.7" "Moderate risk"
[1] "Smoker" "30.9" "Moderate risk"
[1] "Smoker" "30.9" "Moderate risk"
[1] "Smoker" "30.9" "Moderate risk"
[1] "Never" "26.3" "Low risk"
[1] "Never" "26.3" "Low risk"
[1] "Never" "26.3" "Low risk"
[1] "Smoker" "26" "Moderate risk"
[1] "Smoker" "26" "Moderate risk"
[1] "Smoker" "26" "Moderate risk"
[1] "Unknown" "24.6" "Low risk"
[1] "Unknown" "24.6" "Low risk"
[1] "Unknown" "24.6" "Low risk"
[1] "Never" "29.3" "Low risk"
[1] "Never" "29.3" "Low risk"
[1] "Never" "29.3" "Low risk"
[1] "Former" "28.5" "Low risk"
[1] "Former" "28.5" "Low risk"
[1] "Former" "28.5" "Low risk"
[1] "Former" "27.1" "Low risk"
[1] "Former" "27.1" "Low risk"
[1] "Former" "27.1" "Low risk"
[1] "Smoker" "35" "Moderate risk"
[1] "Smoker" "35" "Moderate risk"
[1] "Smoker" "35" "Moderate risk"
[1] "Smoker" "31.6" "Moderate risk"
[1] "Smoker" "31.6" "Moderate risk"
[1] "Smoker" "31.6" "Moderate risk"
[1] "Smoker" "32.1" "Moderate risk"
[1] "Smoker" "32.1" "Moderate risk"
[1] "Smoker" "32.1" "Moderate risk"
[1] "Never" "35.6" "Moderate risk"
[1] "Never" "35.6" "Moderate risk"
[1] "Never" "35.6" "Moderate risk"
[1] "Former" "32.8" "Low risk"
[1] "Former" "32.8" "Low risk"
[1] "Former" "32.8" "Low risk"
[1] "Smoker" "33.9" "Moderate risk"
[1] "Smoker" "33.9" "Moderate risk"
[1] "Smoker" "33.9" "Moderate risk"
[1] "Smoker" "26.8" "Moderate risk"
[1] "Smoker" "26.8" "Moderate risk"
[1] "Smoker" "26.8" "Moderate risk"
[1] "Former" "17.3" "Low risk"
[1] "Former" "17.3" "Low risk"
[1] "Former" "17.3" "Low risk"
[1] "Former" "22.2" "Low risk"
[1] "Former" "22.2" "Low risk"
[1] "Former" "22.2" "Low risk"
[1] "Unknown" "39.9" "Moderate risk"
[1] "Unknown" "39.9" "Moderate risk"
[1] "Unknown" "39.9" "Moderate risk"
[1] "Smoker" "26.7" "Moderate risk"
[1] "Smoker" "26.7" "Moderate risk"
[1] "Smoker" "26.7" "Moderate risk"
[1] "Smoker" "57.1" "High risk"
[1] "Smoker" "57.1" "High risk"
[1] "Smoker" "57.1" "High risk"
[1] "Smoker" "28.3" "Moderate risk"
[1] "Smoker" "28.3" "Moderate risk"
[1] "Smoker" "28.3" "Moderate risk"
[1] "Unknown" "35.4" "Moderate risk"
[1] "Unknown" "35.4" "Moderate risk"
[1] "Unknown" "35.4" "Moderate risk"
[1] "Unknown" "26.9" "Low risk"
[1] "Unknown" "26.9" "Low risk"
[1] "Unknown" "26.9" "Low risk"
[1] "Never" "23.2" "Low risk"
[1] "Never" "23.2" "Low risk"
[1] "Never" "23.2" "Low risk"
[1] "Unknown" "30.4" "Low risk"
[1] "Unknown" "30.4" "Low risk"
[1] "Unknown" "30.4" "Low risk"
[1] "Former" "34.9" "Low risk"
[1] "Former" "34.9" "Low risk"
[1] "Former" "34.9" "Low risk"
[1] "Smoker" "33.9" "Moderate risk"
[1] "Smoker" "33.9" "Moderate risk"
[1] "Smoker" "33.9" "Moderate risk"
[1] "Former" "26.3" "Low risk"
[1] "Former" "26.3" "Low risk"
[1] "Former" "26.3" "Low risk"
[1] "Smoker" "23" "Moderate risk"
[1] "Smoker" "23" "Moderate risk"
[1] "Smoker" "23" "Moderate risk"
[1] "Former" "43.6" "Moderate risk"
[1] "Former" "43.6" "Moderate risk"
[1] "Former" "43.6" "Moderate risk"
[1] "Never" "25.2" "Low risk"
[1] "Never" "25.2" "Low risk"
[1] "Never" "25.2" "Low risk"
[1] "Never" "22.8" "Low risk"
[1] "Never" "22.8" "Low risk"
[1] "Never" "22.8" "Low risk"
[1] "Smoker" "31.2" "Moderate risk"
[1] "Smoker" "31.2" "Moderate risk"
[1] "Smoker" "31.2" "Moderate risk"
[1] "Former" "16.6" "Low risk"
[1] "Former" "16.6" "Low risk"
[1] "Former" "16.6" "Low risk"
[1] "Never" "22" "Low risk"
[1] "Never" "22" "Low risk"
[1] "Never" "22" "Low risk"
[1] "Smoker" "20.8" "Moderate risk"
[1] "Smoker" "20.8" "Moderate risk"
[1] "Smoker" "20.8" "Moderate risk"
[1] "Former" "30.5" "Low risk"
[1] "Former" "30.5" "Low risk"
[1] "Former" "30.5" "Low risk"
[1] "Never" "18.8" "Low risk"
[1] "Never" "18.8" "Low risk"
[1] "Never" "18.8" "Low risk"
[1] "Never" "25.9" "Low risk"
[1] "Never" "25.9" "Low risk"
[1] "Never" "25.9" "Low risk"
[1] "Unknown" "26.2" "Low risk"
[1] "Unknown" "26.2" "Low risk"
[1] "Unknown" "26.2" "Low risk"
[1] "Never" "32.9" "Low risk"
[1] "Never" "32.9" "Low risk"
[1] "Never" "32.9" "Low risk"
[1] "Unknown" "42.9" "Moderate risk"
[1] "Unknown" "42.9" "Moderate risk"
[1] "Unknown" "42.9" "Moderate risk"
[1] "Former" "27.7" "Low risk"
[1] "Former" "27.7" "Low risk"
[1] "Former" "27.7" "Low risk"
[1] "Unknown" "23" "Low risk"
[1] "Unknown" "23" "Low risk"
[1] "Unknown" "23" "Low risk"
[1] "Unknown" "39.6" "Moderate risk"
[1] "Unknown" "39.6" "Moderate risk"
[1] "Unknown" "39.6" "Moderate risk"
[1] "Never" "29.2" "Low risk"
[1] "Never" "29.2" "Low risk"
[1] "Never" "29.2" "Low risk"
[1] "Never" "28.1" "Low risk"
[1] "Never" "28.1" "Low risk"
[1] "Never" "28.1" "Low risk"
[1] "Smoker" "34.5" "Moderate risk"
[1] "Smoker" "34.5" "Moderate risk"
[1] "Smoker" "34.5" "Moderate risk"
[1] "Never" "39.2" "Moderate risk"
[1] "Never" "39.2" "Moderate risk"
[1] "Never" "39.2" "Moderate risk"
[1] "Smoker" "39.1" "High risk"
[1] "Smoker" "39.1" "High risk"
[1] "Smoker" "39.1" "High risk"
[1] "Never" "24.5" "Low risk"
[1] "Never" "24.5" "Low risk"
[1] "Never" "24.5" "Low risk"
[1] "Smoker" "35.6" "High risk"
[1] "Smoker" "35.6" "High risk"
[1] "Smoker" "35.6" "High risk"
[1] "Never" "36.5" "Moderate risk"
[1] "Never" "36.5" "Moderate risk"
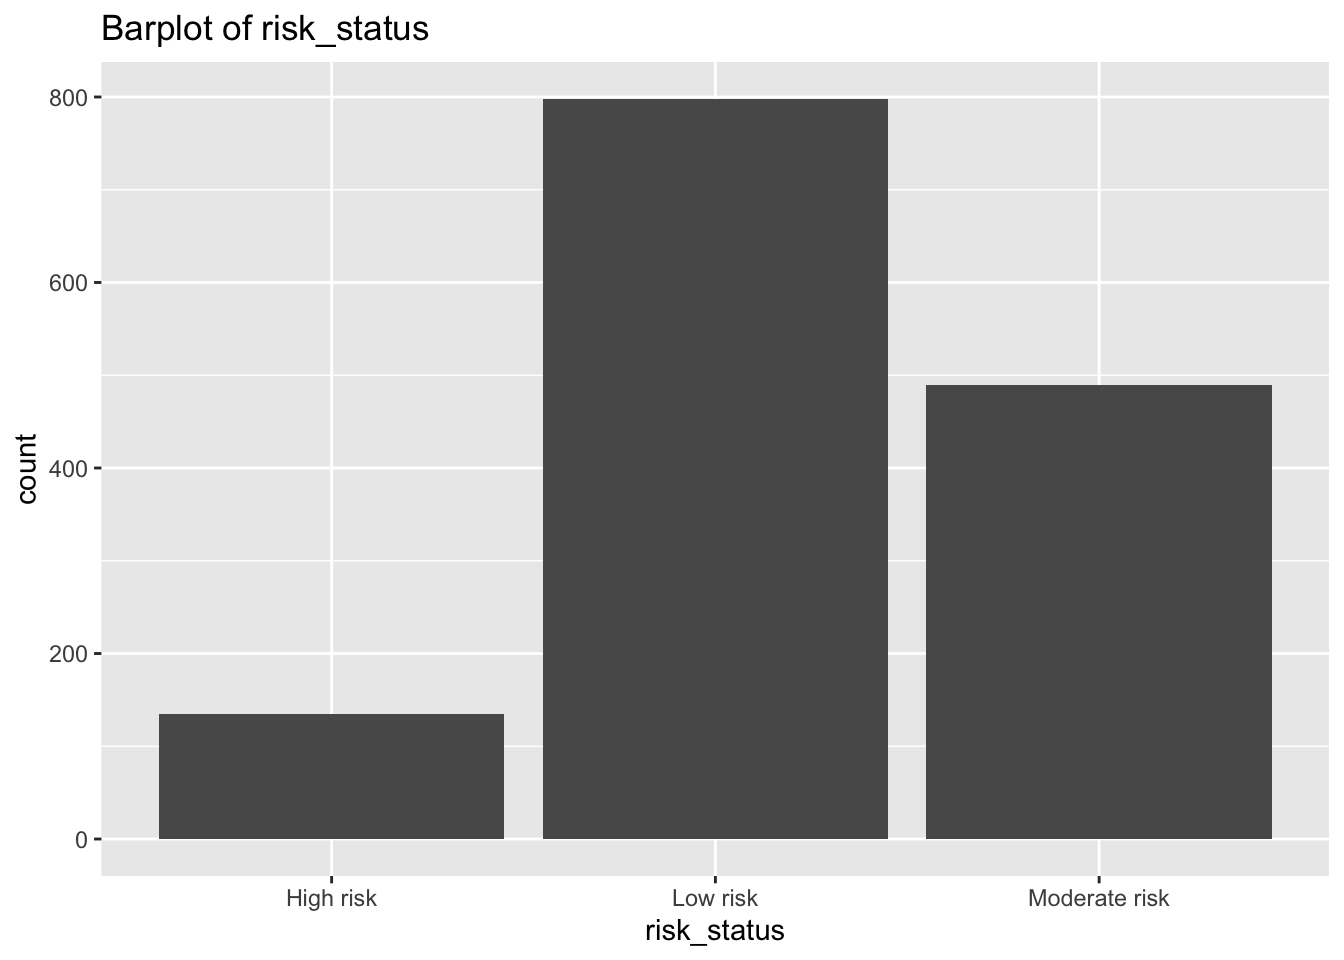
[1] "Never" "36.5" "Moderate risk"- Do the same as above but instead of printing the risk status, append it to a list. Start by initiating an empty list.
# Solution 1

# Initiate list
risk_status <- list()

for (i in 1:nrow(diabetes_glucose)) {
  Smoker <- diabetes_glucose$Smoker[i]
  BMI <- diabetes_glucose$BMI[i]

  if (Smoker == 'Smoker' & BMI > 35){
    risk_status <- append(risk_status, 'High risk')
  } else if (Smoker == 'Smoker' | BMI > 35) {
    risk_status <- append(risk_status, 'Moderate risk')
  } else {
    risk_status <- append(risk_status, 'Low risk')
  }
}


# Solution 2
# Initiate list
risk_status <- list()

for (i in 1:nrow(diabetes_glucose)) {
  Smoker <- diabetes_glucose$Smoker[i]
  BMI <- diabetes_glucose$BMI[i]

  if (Smoker == 'Smoker' & BMI > 35){
    risk_status[i] <- 'High risk'
  } else if (Smoker == 'Smoker' | BMI > 35) {
    risk_status[i] <- 'Moderate risk'
  } else {
    risk_status[i] <- 'Low risk'
  }
}
risk_status %>% head()[[1]]
[1] "Low risk"
[[2]]
[1] "Low risk"
[[3]]
[1] "Low risk"
[[4]]
[1] "Low risk"
[[5]]
[1] "Low risk"
[[6]]
[1] "Low risk"- Check the length of the list. Is it as expected?
Since we looped through all the rows in the diabetes_glucose dataframe, the list should be as long as there are row in the dataframe.
length(risk_status)[1] 1422nrow(diabetes_glucose)[1] 1422- Add the list as a new column in the
diabetes_glucosedata frame. Note: Before assigning it, use theunlist()function to convert the list to a flat vector. This ensures that each value aligns correctly with the rows of the data frame.
# Solution 1
diabetes_glucose$risk_status <- unlist(risk_status)

# Solution 2
diabetes_glucose <- diabetes_glucose %>%
  mutate(risk_status = unlist(risk_status))
diabetes_glucose %>% select(BMI, Smoker, risk_status)# A tibble: 1,422 × 3
BMI Smoker risk_status
<dbl> <chr> <chr>
1 25.4 Never Low risk
2 25.4 Never Low risk
3 25.4 Never Low risk
4 24.6 Never Low risk
5 24.6 Never Low risk
6 24.6 Never Low risk
7 24.9 Unknown Low risk
8 24.9 Unknown Low risk
9 24.9 Unknown Low risk
10 37.1 Unknown Moderate risk
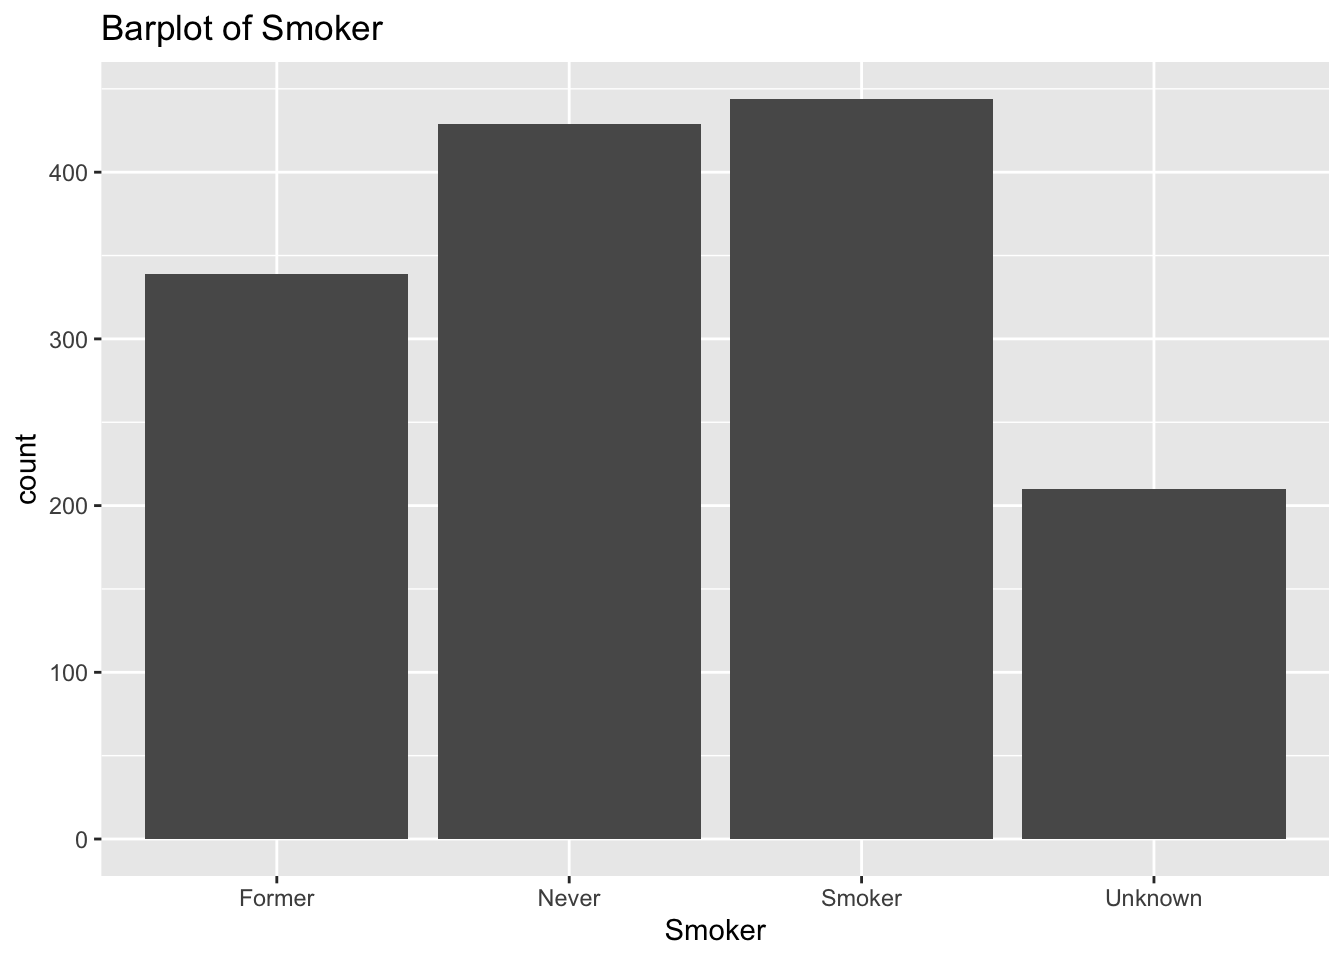
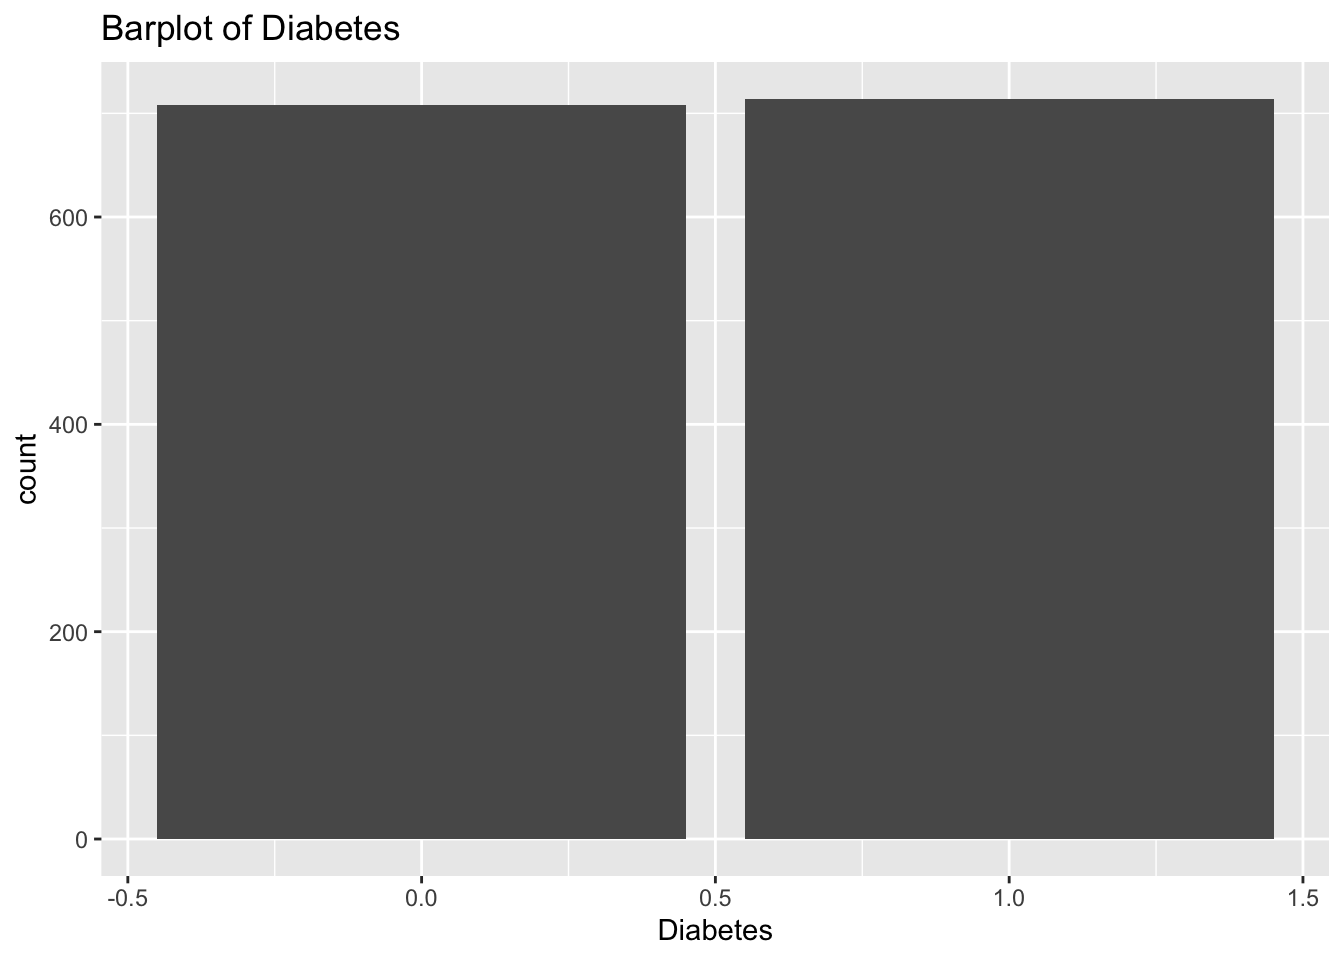
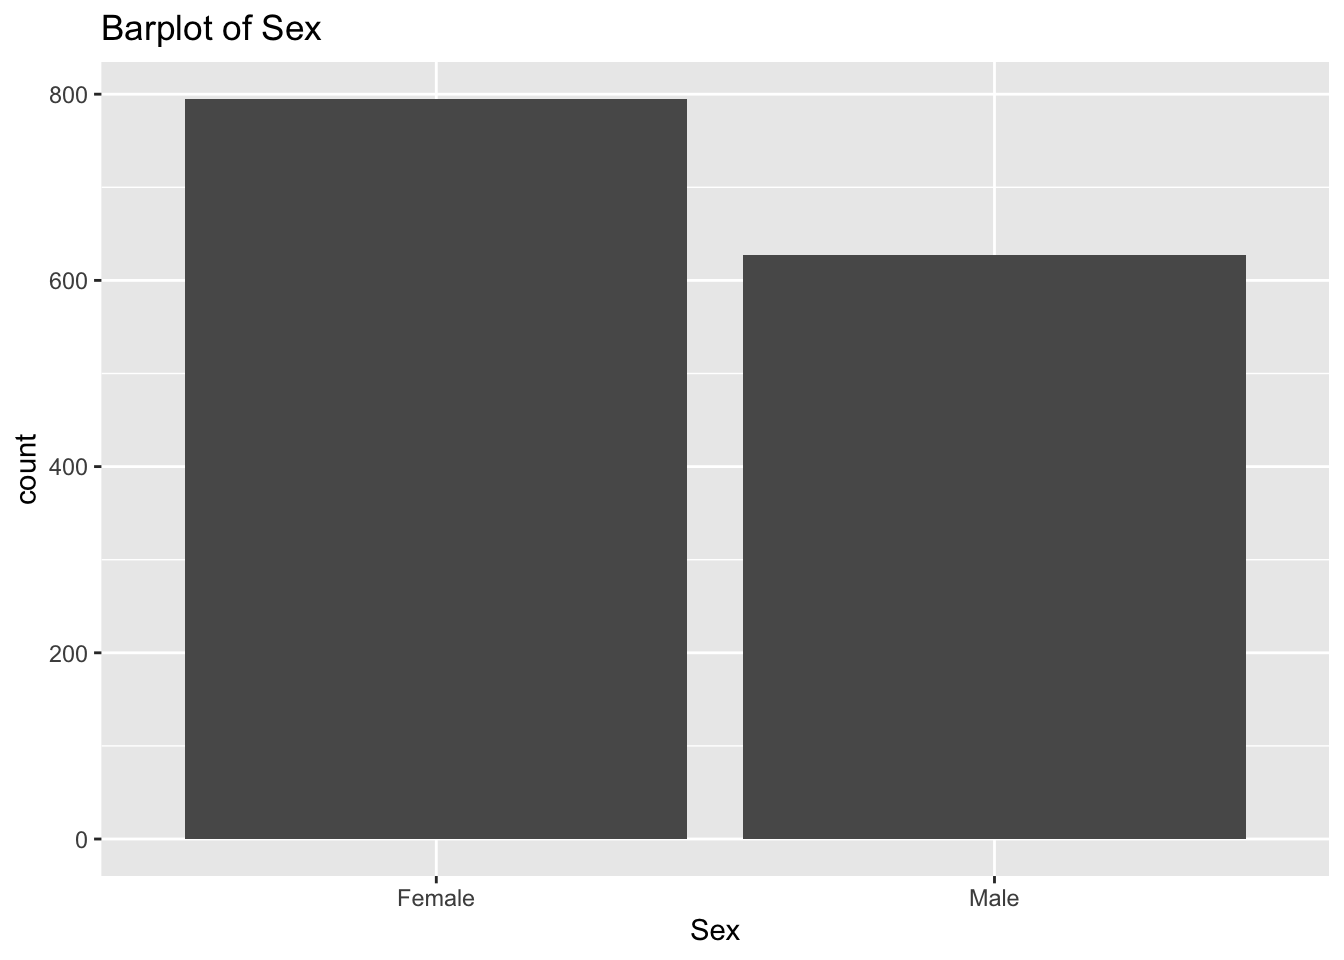
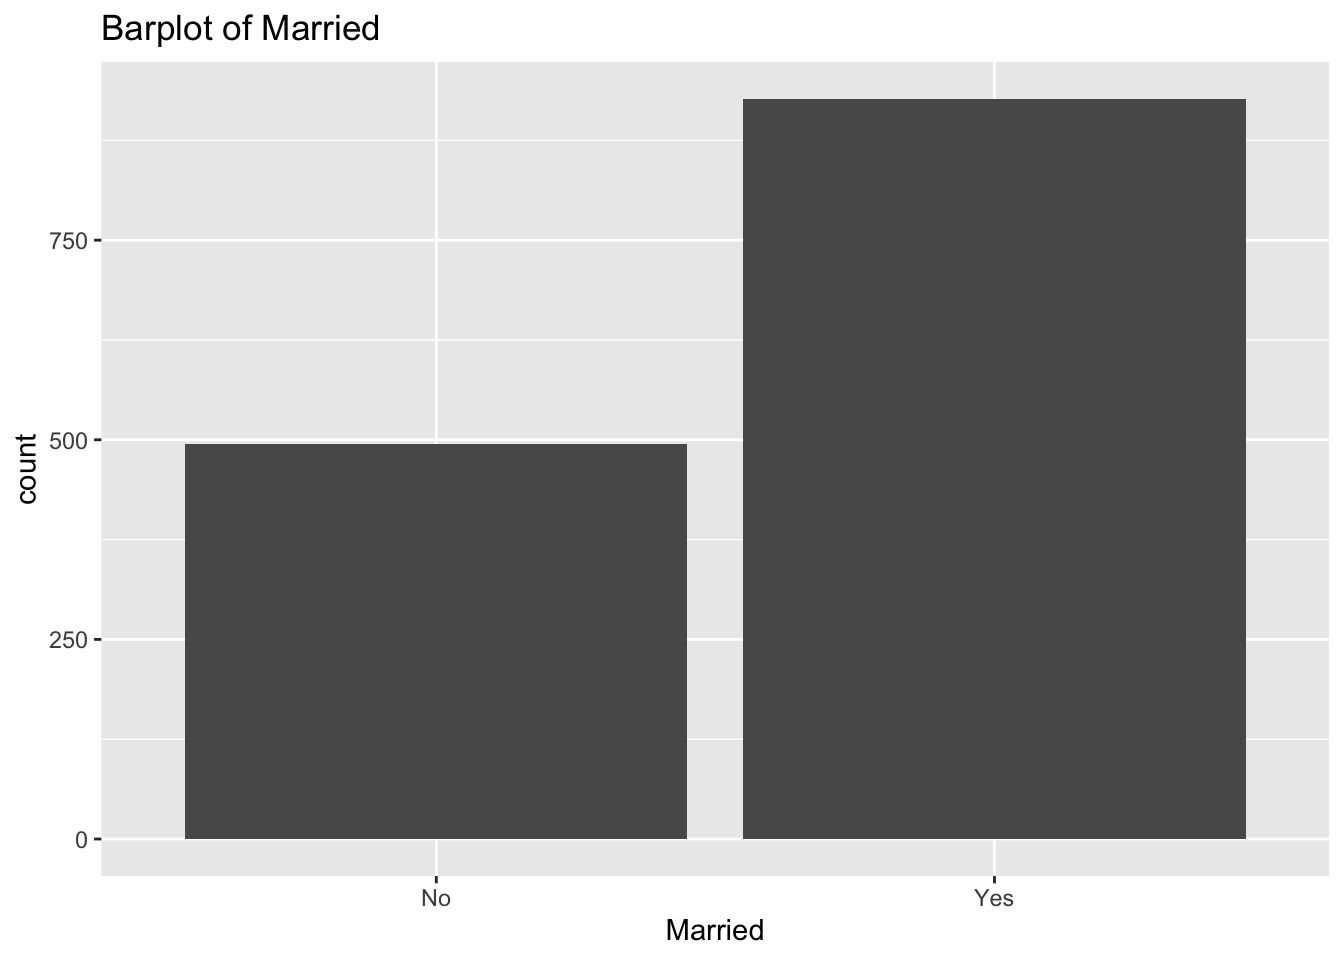
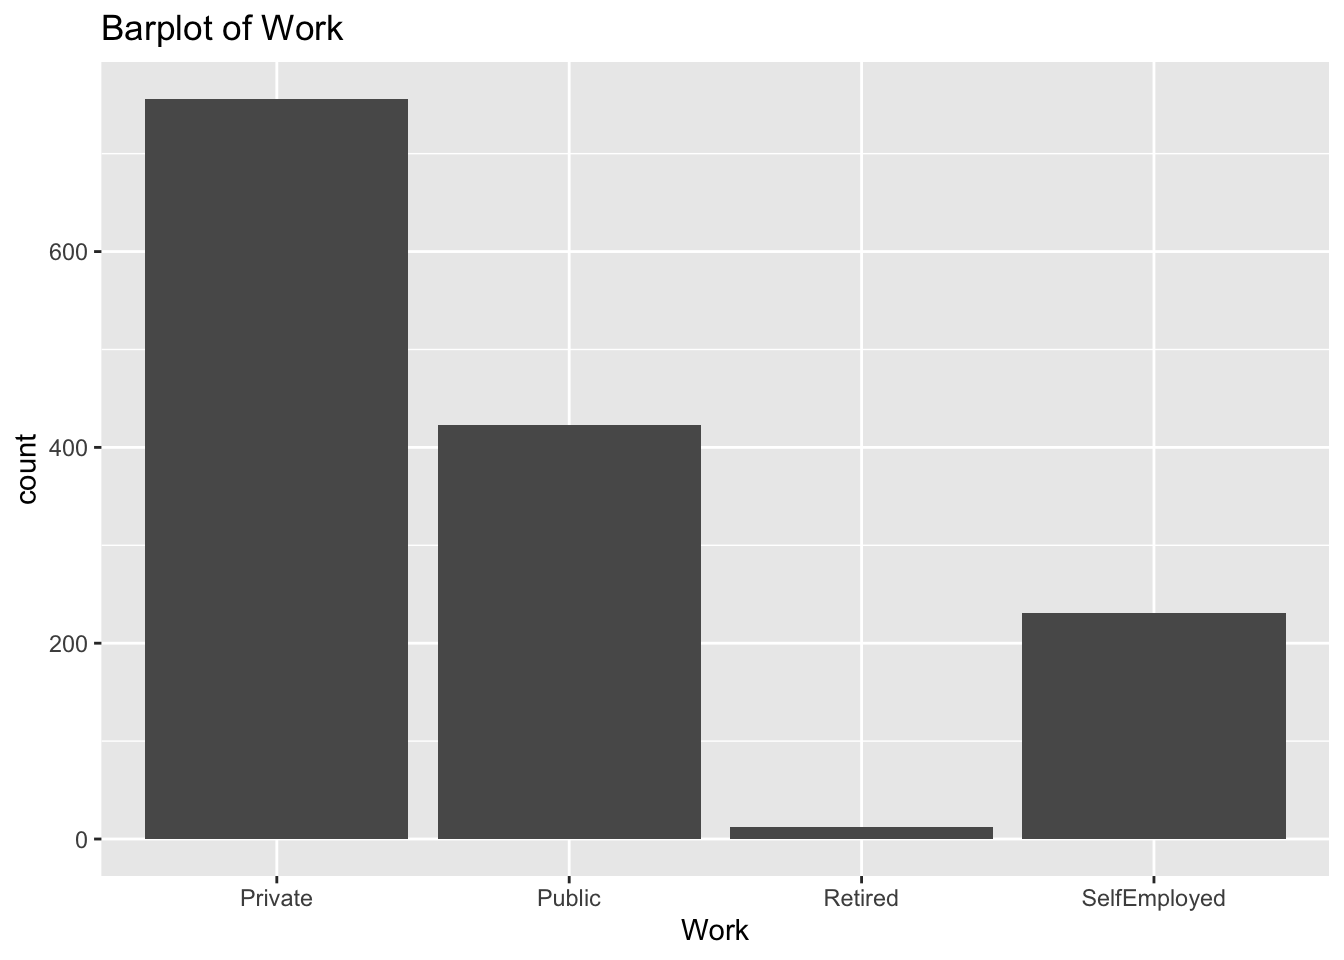
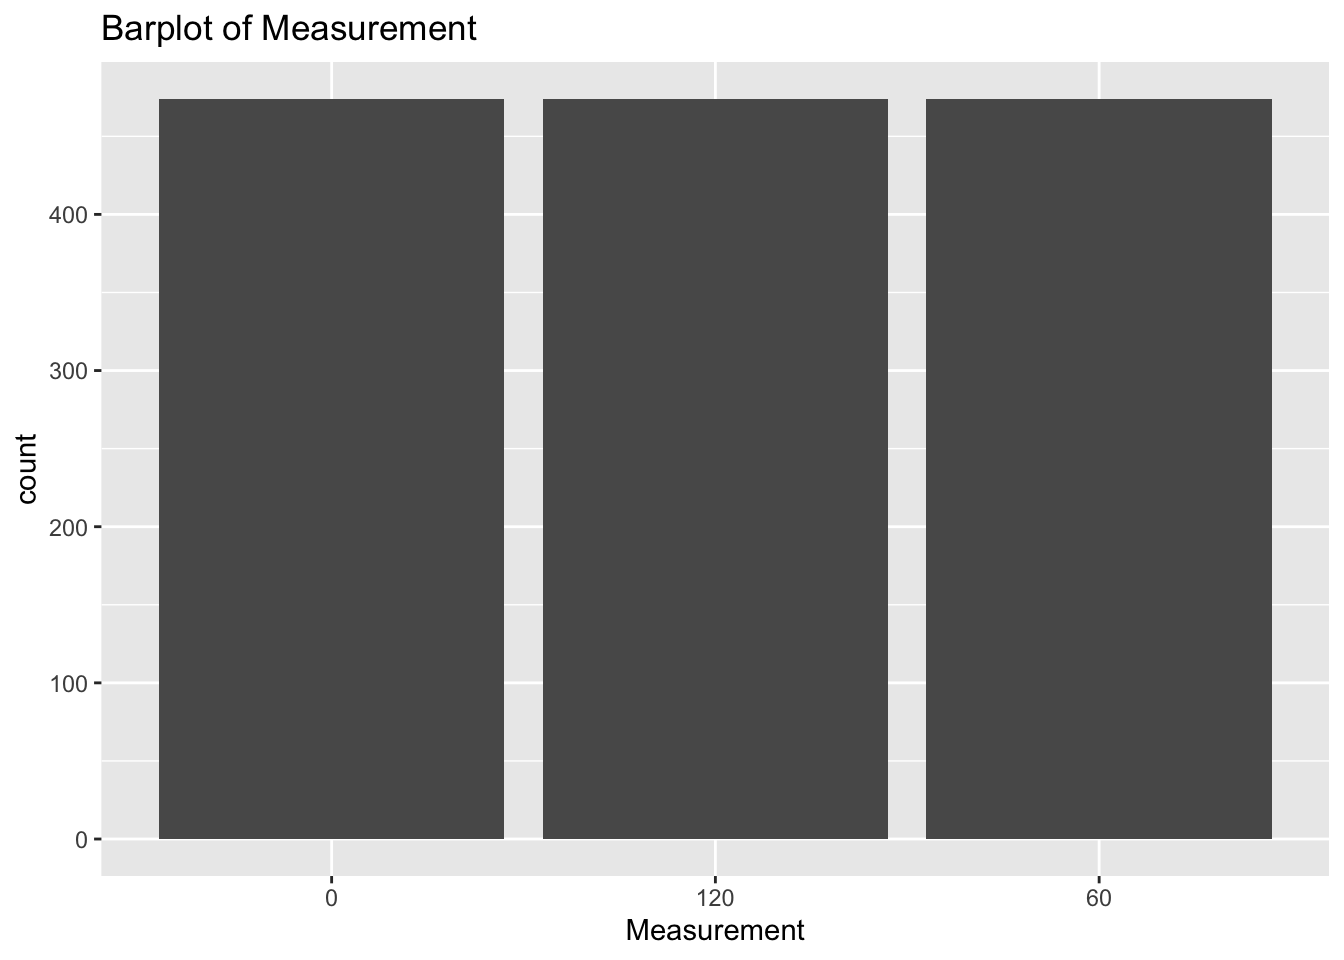
# ℹ 1,412 more rows- Make a list of all the column names in
diabetes_glucosethat contain categorical variables. Write aforloop that goes through the list and prints a barplot for each of the categorical variables.
# List solutions
categorical <- list('Sex', 'Smoker', 'Diabetes', 'Married', 'Work')

for (var in categorical) {

  p <- ggplot(diabetes_glucose, aes(x = .data[[var]])) +
    geom_bar() +
    labs(title = paste("Barplot of", var))

  print(p)
}


# Check column data type solutions:
for (var in colnames(diabetes_glucose)) {

  if (is.character(diabetes_glucose[[var]])) {

    p <- ggplot(diabetes_glucose, aes(x = .data[[var]])) +
      geom_bar() +
      labs(title = paste("Barplot of", var))

    print(p)
  }
}

- Make a list of all the column names in
diabetes_glucosethat contain numeric variables. Make a for loop that goes through the list and prints a boxplot for each of the categorical variables.
head(diabetes_glucose)# A tibble: 6 × 14
ID Sex Age BloodPressure BMI PhysicalActivity Smoker Diabetes
<chr> <chr> <dbl> <dbl> <dbl> <dbl> <chr> <dbl>
1 34120 Female 28 75 25.4 92 Never 0
2 34120 Female 28 75 25.4 92 Never 0
3 34120 Female 28 75 25.4 92 Never 0
4 27458 Female 55 72 24.6 86 Never 0
5 27458 Female 55 72 24.6 86 Never 0
6 27458 Female 55 72 24.6 86 Never 0
# ℹ 6 more variables: Serum_ca2 <dbl>, Married <chr>, Work <chr>,
# Measurement <chr>, `Glucose (mmol/L)` <dbl>, risk_status <chr>numeric <- list('Age', 'BloodPressure', 'BMI', 'PhysicalActivity', 'Serum_ca2')for (var in numeric) {
p <- ggplot(diabetes_glucose, aes(y = .data[[var]], fill=risk_status)) +
geom_boxplot() +
labs(title = paste("Barplot of", var))
print(p)
}Warning: Removed 6 rows containing non-finite outside the scale range
(`stat_boxplot()`).